
BDC Portfolio Returns Update: November 2021

Summary
The following tables show the total returns for each suggested BDC portfolio compared to the S&P 500, Vanguard Real Estate (VNQ), Mortgage REIT Index (REM), and high-yield bonds (HYG/JNK).
The 3-year returns assume that you did not purchase additional shares during general market volatility which is very unlikely if you are using this service correctly.
I have also included a quick discussion of the suggested portfolios for new subscribers as well as a quick update for NEWT at the end.
The returns for the last 3 years are excellent for the Total Return portfolio especially since it assumes you did not dollar average purchases at lower prices.
Maximizing BDC Total Returns
BDC pricing can be volatile and the best way to invest in these income vehicles is through dollar averaging purchases during the general market pullbacks. Don't get me wrong, higher quality BDCs are excellent "buy and hold" investments (as shown later) but to get the real bang for your buck it is better to "buy more on the dips."
September 2021 Example
I'm constantly watching the sector updating subscribers of potential issues and pricing opportunities. Please see "Get Ready For Volatility!" from September 2021 for an example. The following table is similar to the one used in the weekly updates showing the lows hit for each BDC and associated returns over the last 7 weeks at 9.1% or over 100% annualized. The point is please be prepared for the next pullback as this service easily pays for itself.

September 24, 2020 Example
The following table shows an example for multiple purchases when BDC prices dipped on September 24, 2020, and have easily outperformed the S&P 500 returning over 88% over the last 13 months.
This is important to point out because this is more than many investments have returned over the last 3 years as shown later.

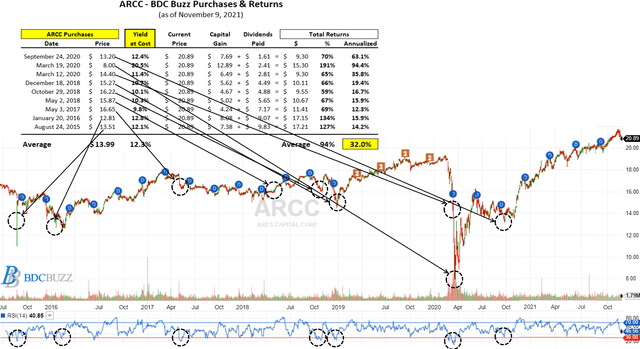
ARCC Example
For a longer-term example, I have made 9 purchases of ARCC over the last 6 years at prices ranging from $8.00 to $16.65 but they all have annualized returns of over 12% and trending higher with an average of 32% as I have been getting better at timing over the years (more patient). The “Annualized” return shown does not use a simple average but shows the actual compounding of annual returns. This is the true return each year.
Previous updates show similar charts/tables for my other larger BDC positions that I add to during general market pullbacks.
Other BDCs
The following are some of the BDCs that I do not actively cover such as BCSF, BKCC, FCRD, LRFC, OXSQ, PFX, PTMN, and SLRC most of which have seriously underperformed with very low (or negative) annualized returns over the last few years.

Portfolio Total Returns Since 2018
The following table shows the total returns for each of the suggested BDC portfolios compared to the S&P 500, Vanguard Real Estate ETF (VNQ), Mortgage REIT Index (REM), and two of the larger high-yield bond ETFs (HYG and JNK). The returns assume that you purchased the share of each BDC at the end of 2018 and did not purchase additional shares during general market volatility which is very unlikely especially if you are one of my subscribers.
However, even if you did not make additional purchases each time the stock dipped below the December 31, 2018 price a handful of BDCs still outperformed the S&P 500, and most have done much better than VNQ, REM, HYG, and JNK.