
BDCs & Interest Rates

Summary
The following is a preview of an upcoming public article discussing BDCs and interest rates.
BDCs are currently yielding an average of 8.4% and higher interest rates will likely drive improved net interest margins and dividend increases.
More importantly, BDC pricing will likely head higher before any rate increases similar to early 2016 outperforming REITs and the S&P 500.
The buying has likely already started as BDCs have been rallying but still have higher relative yields as discussed below.
It should be noted that the initial impact from rising rates will be muted due to floors but more importantly, is the impact on pricing as BDCs are a good place to be during rising rates.
The following information was previously provided to subscribers of BDC Buzz along with target prices, dividend coverage and risk profile rankings, earnings/dividend projections, quality of management, fee agreements, and my personal positions for all Business Development Companies (“BDCs”).
Interest Rates
Yesterday the Fed signaled the potential for higher interest rates in 2023, a year earlier than expected increasing concerns of potential/eventual tightening as the economy heats up. Sure 2023 seems far away but the timetable for rate increases could accelerate not to mention getting priced certain investments well before the Fed makes additional announcements. This previously happened with business development companies ("BDCs") in early 2016 driving higher stock prices well before the Fed increased beyond 0.50% which directly impacts the underlying rates for BDC loans that are mostly at variable rates as discussed next. This article will not attempt to predict when benchmark rates will rise as I am more focused on asset purchases and anything that impacts the yield curve and more importantly yield spreads that directly impact BDC earnings and pricing as discussed at the end.

BDC Net Interest Margins & Interest Rate Sensitivity
Net interest margins are the difference between interest income from portfolio investments and interest expense on borrowings/debt. Over the last six quarters, most BDCs have loaded up (see chart below) on fixed-rate unsecured borrowings at ridiculously low rates.
Just this month many BDCs have issued additional notes including Ares Capital (ARCC) with $850 million at 2.875% for 7 years and FS KKR Capital (FSK) with $400 million at 2.625% for 5.6 years. Last month Prospect Capital (PSEC) issued $300 million of 3.364% notes due 2026 and Oaktree Specialty Lending (OCSL) issued an additional $350 million of 2.70% due 2027. These notes are very flexible compared to credit lines/revolvers and are longer-term than most portfolio investments which are important when matching assets and liabilities. PSEC's notes are at higher rates due to its portfolio credit quality as discussed in "PSEC Update: Same 4 Investments Carry The Company".

As shown below, Hercules Capital (HTGC) has a very strong balance sheet (from a liability standpoint) with 100% at fixed rates once the small amount of SBA debentures are locked in and mostly unsecured. Also, 96.8% of its debt portfolio is floating rate loans that will benefit from rising rates after taking into account floors.


Source: HTGC Investor Presentation
Most BDCs provide the potential impact to earnings based on changes to interest rates including HTGC below:

Source: HTGC Investor Presentation
It is important to note the HTGC maintains a “variable distribution policy” with the objective of distributing four quarterly distributions in an amount that approximates 90% to 100% of the company’s taxable quarterly income or potential annual income. In addition, the company pays additional supplemental distributions to distribute approximately all its annual taxable income in the year it was earned, or it can elect to maintain the option to spill over the excess taxable income into the coming year for future distribution payments.
We have a variable dividend policy, so it's something that the Board evaluates on a quarterly basis, and we don't just look short-term, we look long-term when we're making those decisions. We've been very clear in terms of our public guidance on the last several calls that we see absolutely no risk to that $0.32 base distribution, and we would reiterate that guidance on this call now. If you think about what we've been able to do in terms of the special distributions, we've been able to deliver to our shareholders a supplemental or a special distribution in six of the last seven quarters on top of the $0.32 base distribution. And obviously, subject to market conditions, I think one of the things that we're going to look at near-term here is trying to find a way to provide a little bit more consistency and continuity to those supplemental distributions.
Source: HTGC Earnings Call
ARCC's portfolio is around 82% floating rate investments and the following table does not take into account the previously discussed $850 million of notes which will have a positive impact:

Source: ARCC 10-Q
OCSL will also benefit from rising rates with around 92% of debt investments at floating rates but will not have much of an impact for the first 100-150 basis points due to floors and impacts to borrowings as shown below:

Source: SEC Filing
Previous Changes in BDC Prices & Recent Returns
As mentioned earlier and shown below, BDC prices climbed in early 2016 as the Fed started to raise rates:


During that period BDCs easily outperformed the S&P 500 and REITs after taking into account dividends paid. The following chart shows comparable total returns for one of the older BDCs Apollo Investment (AINV) along with the Vanguard Real Estate Index (VNQ) compared to the S&P 500 and the previously discussed HTGC and ARCC.

As a quick follow up to the article last week "This High-Yield Sector Continues To Pummel REITs" the following charts show comparable returns for one and three years with BDCs easily outperforming equity REITs and Mortgage REIT Index (REM):

BDC Dividend Yields & Pricing
BDCs trade with a wide range of multiples mostly related to risk profile, management, and expected returns through dividends, realized gains, and NAV growth. This drives a wide range of dividend yields mostly between 6% and 10% with a current average of 8.4% as shown below.
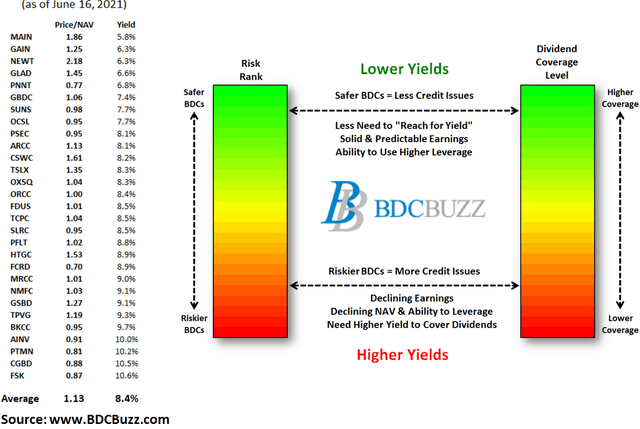
I closely watch the credit yield spreads between BDC common stocks and other investments including the BofA Merrill Lynch 'US Corporate Single-B Index’ and 'US Corporate CCC & Lower Index’. The average yields for Single-B and CCC & Lower indices have plummeted to all-new historic lows typically driven by higher prices. The CCC & Lower is true junk debt and lower quality relative to most BDCs which is why historically it has higher yields but recently flipped at 6.8% compared to the average BDC at 8.4%. This is important for many reasons and there is definitely an imbalance in the current pricing. Basically, investors are searching for yield and purchasing lower credit quality rather than BDCs which will likely reverse back at some point especially as net interest margins continue to improve for the reasons discussed earlier.

What Can I Expect Each Week From BDC Buzz?
Weekly BDC Sector Update - Before the markets open Monday morning we provide quick updates for the sector including significant events for each of the companies that we follow along with upcoming earnings, reporting, and ex-dividend dates. Also, we provide a list of the best-priced opportunities along with oversold/overbought conditions, what to look for in the coming week, and any other meaningful economic events that need to be considered for the sector.
Deep Dive Projection Reports - Detailed reports on 2 to 3 BDCs per week prioritized by first focusing on potential issues such as dividend coverage and/or portfolio credit quality changes. We look for portfolio updates that might be mentioned in the SEC filings as compared to company announcements. Then, reports are prioritized based on pricing opportunities including equity offerings.