


Quick Discussion Of Portfolio Allocations


Weekly Updates – We provide quick updates for the sector, including significant events for each BDC, upcoming earnings, and ex-dividend dates. Also, we provide a list of the best-priced opportunities, oversold/overbought conditions, and what to look for in the coming week (including upcoming reports).
Deep Dive Projection Reports – Detailed reports on individual BDCs are prioritized each week by focusing on buying opportunities and/or potential issues such as changes in portfolio credit quality and/or dividend coverage (usually related). This should help subscribers create a shopping list ready for the next general market pullback (typically, 3 to 5 each year).
Weekly General Updates or Comparison Reports – A series of updates discussing expense/return ratios, dividend coverage, 'Building a BDC Portfolio', suggested pricing and limit orders, interest rates, leverage, Investment Grade BDC Bonds/Notes, portfolio mix, and risk profiles.
This week, we are discussing portfolio allocations, including where BDC stocks and bonds fit. Please use the following link to access all the recently updated reports, including side-by-side comparison reports and individual company updates:
Portfolio Allocations: BDC Stocks & Bonds
This information will be discussed next week, including investment-grade BDC bonds.
Many subscribers ask where BDC stocks and bonds fit into their overall portfolio. Your portfolio allocations depend on a few factors, including your age, overall risk appetite, investment time frame, and need to access capital. Historically, investment advisors used the “100 minus your age” axiom to estimate the stock portion of your portfolio. However, that was likely when the average life expectancy was 65 to 70, compared to the current 85 or higher, depending on many factors, and has been revised to 120. For example, if you're 60, 60% of your portfolio should be in stocks and the other 40% in safer investments, including bonds. However, it also depends on your overall risk appetite, investment time frame, and need to access capital.
BDC stocks are for longer-term investors, so please allow an investment time frame of at least three years, compared to their bonds, which are suitable for both longer and shorter-term positions. Also, bonds provide reduced price volatility during market drawdowns, outperforming other higher-yield assets during market sell-offs. Around 40% of my portfolio remains invested in corporate bonds, which are primarily held with BDCs. My cash allocation remains around 11%, which is much higher than I need, and I will continue to make purchases over the coming months. Sure, a 3% to 4% yield on cash is attractive, but it will likely head lower over the coming quarters.
The following charts use the oversimplified asset classes of cash, treasuries, corporate bonds/notes, other stocks (general market equities), and higher-yield investments (including BDCs/CEFs/REITs), along with some examples of allocations and my portfolio (not exact).

As shown below, I have many bond positions in BDCs in which I do not own the common stock, including FSK, GSBD, MFIC, OCSL, and TCPC. As mentioned later, baby bonds are traded using tickers/symbols, which is easier for investors new to investing in fixed-income (bonds). We have not focused on the BDC bonds, mostly related to very low yield spreads, which do not adequately compensate investors for the risk premium relative to owning treasuries. However, these spreads have started to widen, and bond yields are improving, which will be discussed in upcoming reports.

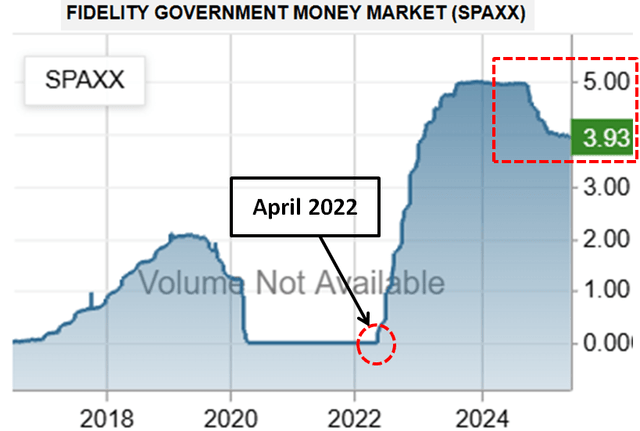
As shown below, money market yields increased from 0.1% in April 2022 to over 5.0% in 2023 but have continued to decline, which will likely continue over the coming quarters:
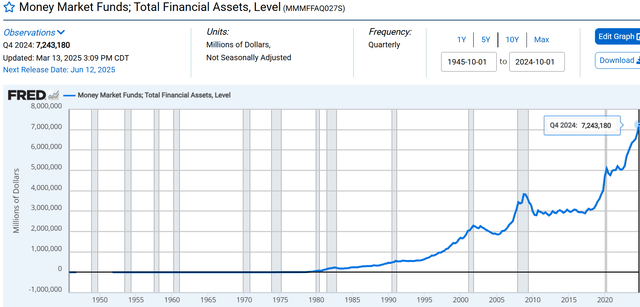
As mentioned in previous updates and reports, there has been a continued surge in money market funds to over $7.2 trillion:
Why is this important? Money market funds are mostly short-term investments that will likely be partially rotated into longer-term investments, including dividend-paying stocks and corporate bonds. Again, BDC stocks are for longer-term investors as compared to their bonds, which are appropriate for longer and shorter-term positions. Also, bonds provide reduced price volatility during market drawdowns, outperforming higher-yield assets during market sell-offs.
The following table uses oversimplified asset classes of money market funds, corporate bonds/notes, other stocks (general market equities), and BDC stocks. Please note that interest rates on savings/money markets were below 1% for a while, and the previous increases have likely awakened investors to the fact that they should have their capital working for them. These tables are important as they show the difference in the earnings potential of a shorter-term focused portfolio with 50% invested in money market funds earning around 4% but likely falling back to previous levels of 2% to 3% (or lower) over the coming quarters/years. This could drive some investors to reallocate capital to longer-term investments at higher yields.
Another way to look at these tables is the difference in earnings potential between the short-term and long-term portfolios of around 3.3% to 3.5% annually. For example, currently, an investor with $1 million could earn $50,450 or $83,690 annually.
This means that investors should adjust allocations towards a longer-term focused portfolio, with appropriate allocations.
Other takeaways:
Short-term portfolios yield 5.0% today but only 2.5% in a lower-yield scenario.
You can invest in a long-term focused portfolio today with an 8.4% yield rather than waiting for lower interest rates (similar to April 2022), closer to 6.1%.

There is one very important aspect not shown in these tables, which is the potential for capital gains through price appreciation if the markets trend toward April 2022 levels. BDC common shares would trend toward LT targets (as discussed in many recent reports) combined with meaningful increases in bond prices as their YTM trend back to 4.0% compared to the current 6.6% which is an average between the baby bonds at 7.4% (shown later) and the other bonds currently around 5.8% (shown later).
The following table is for investors who are mostly focused on portfolio yield as well as capital preservation. Please keep in mind that if rates head lower, bond prices could continue higher, especially safer bonds as they approach maturity. Dividend-paying stocks become more attractive with equity upside if the economy continues to show signs of stability or strength. Also, lower rates have a positive impact on the credit quality of portfolio companies due to lower payments driving higher coverage ratios (less likely to default). Investors should have a well-balanced portfolio based on their needs and be ready for any scenario.
Investor #1 - Believes the economy will continue to be stable and/or grow with a 'soft' or 'no landing' scenario that only impacts certain cyclical sectors or lower credit quality companies. Rates and yield expectations will likely continue lower in this scenario, resulting in BDC prices heading back to their longer-term (“LT”) targets.
Investor #2 - Believes that we are headed for another increase in inflation and/or a 'hard landing' that will negatively impact almost all/most sectors and companies. Rates and yield expectations will likely remain higher in this scenario, resulting in BDC prices continuing to trade near or below their short-term (“ST”) targets.
Investor #3 - Believes that we will experience a deep, broad (all sectors), and/or extended recession similar to the Great Recession in 2008 and 2009. These investors should focus on higher-quality investment-grade bonds.

BDCs with lower amounts of watch list investments continue to report stable-to-growing NAV per share with no meaningful increases in non-accruals, and pricing will likely continue to rally back over their ST targets and head toward LT targets (next 12 to 24 months).
If #1 ends up being correct, I will simply wish that I bought more (using excess cash which would be “trash” if interest rates are materially lower).
If #2 is correct, I will have a chance to buy more BDC stocks and bonds - this is a good scenario as I can get higher returns.
If #3 is correct, I can ‘back up the truck’ and make massive purchases as I did in early 2020 with excellent returns.
The following chart shows the average BDC yield over the last 14 years, which includes regular, special, and supplemental dividends. The average is around 10.0%, which includes the COVID period when average yields ranged from 12% to 19% for 8 months. Historically, the typical range was 9% to 11%, but remains higher since the April 2022 lows, likely due to higher yield expectations from investors given the higher interest rates. However, rates will likely head lower through 2026, and BDC yields will follow as yield expectations from investors decline, combined with supportive economic data. Please note that the average BDC yield was 8.8% in April 2022 (when many BDCs were trading near their LT targets), with ARCC and GBDC near the lower end of around 8.0% compared to FSK, MFIC, and CGBD closer to 10.0%.

For subscribers new to investing in bonds/fixed income, I would suggest starting with the baby bonds, which are traded using tickers and typically have higher yields, mostly due to potentially being called early. The BDC bonds, which are typically traded using CUSIPs, include a ‘make-whole call’ provision, which compensates bondholders for the interest they would have earned if their bonds had not been called/redeemed before the maturity date. Baby bonds do not have this feature, which is partially why they are still yielding around 7.46% (using yield-to-maturity) with an average yield spread to treasuries over 3.48%, which is considered high.
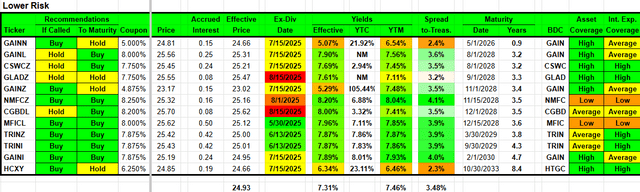
The following chart shows the recent yield-to-maturity of the BDC bonds with ‘make-whole call’ provisions. Please keep in mind that PSEC and TCPC were previously downgraded to junk status and are not considered investment-grade.

Did you invest in higher growth stocks when you were younger or have you always had a mostly BDC/bond portfolio?