


ARCC Update: Lower Earnings, But Credit Quality Remains Strong


Please use the following link to access all the recently updated reports, including side-by-side comparison reports and individual company updates:

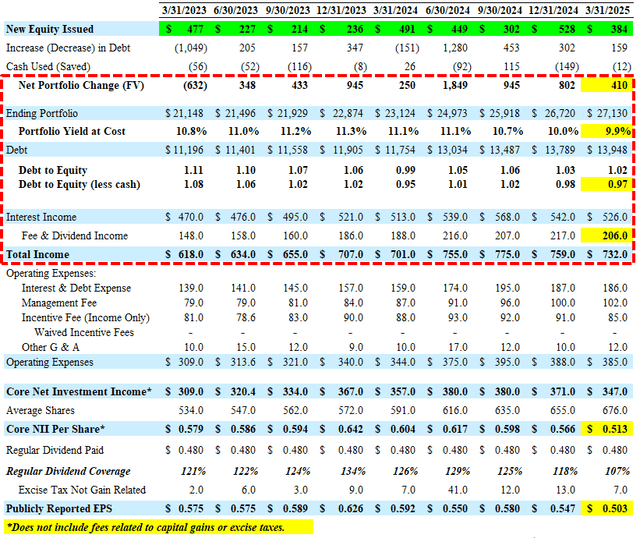
For Q1 2025, Ares Capital ( ARCC 0.00%↑ ) reported between its base and worst-case projections, mostly due to lower-than-expected net portfolio growth combined with issuing over 17 million shares, resulting in lower leverage (and lower earnings), covering its regular dividend by 107% (excluding excise tax of $7 million).
“There was a special dividend from Ivy Hill in the fourth quarter that actually contributed about $0.01 of earnings per share for us in the fourth quarter. And that was just a onetime special dividend. So that did not reoccur this quarter. We did have a slight increase in the regular dividend from Ivy Hill from the fourth quarter to this quarter, but that's the answer.”
“Our decline in core earnings was largely driven by the decline in our portfolio yields based upon the lower average market base rates, which occurred during the fourth quarter of last year. As you may recall from our last couple of earnings calls, there's typically up to a 1 quarter lag to reflect the full quarter impact on interest income from the changes in period end yields that we report for the most recent quarter. Simply put, impact from the changes in portfolios during the fourth quarter were the primary driver of the sequential change in our core earnings for the first quarter. The good news here is that yields in our portfolio have generally stabilized through the end of the first quarter.”
“Importantly, unlike the 70 basis point decline we experienced in our weighted average yield on total investments from the end of the third quarter to the end of the fourth quarter of 2024, we only experienced a 10 basis point decline from the end of the fourth quarter to end of this past quarter. Therefore, all things being equal, we should see more stable levels of interest income for this coming second quarter.”
ARCC reaffirmed its regular dividend of $0.48 per share, as expected in the previous base case projections (as shown in the BDC Google Sheets).
“ARCC has been paying stable or increasing regular quarterly dividends for over 15 consecutive years. In terms of our taxable income spillover, we currently estimate we will have $883 million or $1.29 per share available for distribution to stockholders in 2025. In addition to our core earnings continue to be in excess of our current dividend, we remain hopeful for some potential portfolio realized gains in the coming quarters, which may further enhance our taxable income spillover.”
Q. “You guys mentioned seemingly relying on spillover seeing if you could expand on that and if you expect to go below the dividend this year and how, I guess, eventually what the drivers would be to come back let's say, at today's curve, come back and a coverage that is.”
A. “I don't think we meant to imply that we're going to go below the dividend on core and dip into the spillover. This year, I think we were mentioning the amount of spillover to just give comfort that there's an additional lever that we have there. To the extent that, that does occur, it's not our expectation. We feel good about the dividend, thin. It's funny when we raised the dividend to $0.48, we were earning core in the mid-60s and people were asking us why wouldn't raise the dividend more than $0.48. And we didn't do it because we knew that rates were pretty elevated and there was some excess spread in the market given the dislocation, and that was likely going to correct. And so we've just kind of seen that happen as we sort of expected, and yields have come down. And we're now back into what I would say is a more normalized environment where we have a little bit of cushion but not as much. It was nice and comfortable to operate with all that cushion, but that isn't the norm, right? So I would just say we're back kind of in the norm now. And as I already talked about before, there's all these different offsets that occur if rates do decline in the future, there's countervailing factors that also help us in that type of environment. So we feel good about the dividend for the foreseeable future.”
As shown below, the amount of first-lien has increased from 46% to 58% of the portfolio over the last four quarters:

Non-accrual investments decreased slightly from 1.0% to 0.9% of the total portfolio fair value, mostly due to exiting/restructuring Vobev (a can-making company that previously filed Chapter 11), Aimbridge Hospitality, and Hearthside Food Solutions, partially offset by adding its watch list investments in Continental Acquisition and Pathway Vet Alliance. Most of these investments have been discussed in previous reports and will be discussed in previous ARCC Deep Dive reports. ARCC has a very large portfolio with 566 portfolio companies valued at $27 billion, so there will always be a certain amount of non-accruals.
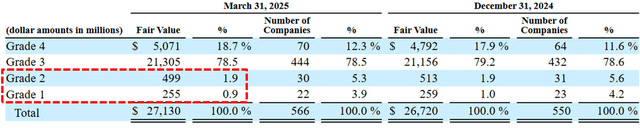
“Our credit quality remains strong and stable with our nonaccrual loans and lower risk rated credits at historically low levels. Our nonaccrual rate at fair value also decreased by 10 basis points to 0.9%. The percentage of our portfolio at fair value in grade 1 and 2 names decreased a further 10 basis points sequentially, ending the quarter at 2.8%, the lowest level we have seen since 2010.”
Q. “Touching on nonaccruals, I know we beat kind of the topic to death, but the feedback that you received from portfolio companies, existing nonaccruals and also your analysis on kind of tariff exposure, can you touch on if you're seeing any thematic patterns in portfolio stress or sectors or industries that have just proactively had outreach in dialogue?”
A. “It's something we're always looking for and trying to draw conclusions around trends to inform our behavior around new investing. Unfortunately, there's just nothing that we're really seeing yet that we can comment on that is -- that we can draw any conclusions around there being a trend. So we'll just have to kind of wait and see, but we can keep talking about that in future quarters.”
Q. “There's a lot of veterinary office roll-ups across the industry as well, and one of them obviously was put on nonaccrual this quarter. So -- is this the beginning of a cycle of that same kind of problem that the issues have moved and now it's the veterinary office roll-ups and we're going to see a lot more problems in that sector or what are your thoughts? Because obviously, you put Thrive or [indiscernible] whatever we want to call it on nonaccrual this quarter?”
A. “I don't know that can help you too much on forward outlook on what that's going to be. I guess all I would say in terms of our portfolio and our exposure to that is it's really minimal. We have less than less than 2% of our portfolio is in physician practice management businesses. That includes vet. So we really just don't have a lot of exposure to that part of the market. I probably just won't venture a guess as to what happens to the future of the veterinary space.”
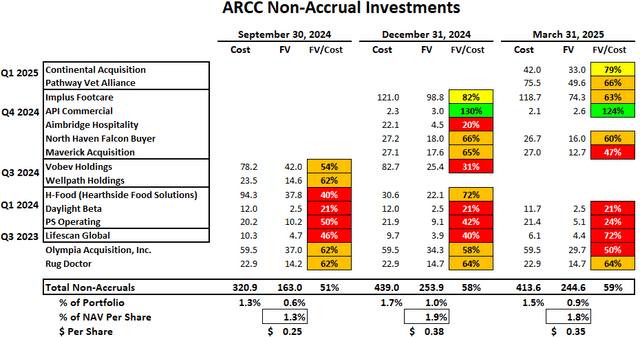
As mentioned in previous reports and updates, Hearthside Food Solutions is also held by OBDC and recently completed its restructuring and emerged from Chapter 11 as Maker’s Pride:
“The swift completion of our financial restructuring process marks a pivotal moment for our company and is a testament to the dedication of our valued team members and committed support of our customers and financial partners. With a healthy balance sheet and additional capital to achieve our goals, we are well-equipped to continue serving our customers with excellence. Through its financial restructuring, the company eliminated approximately $2 billion of funded debt, substantially reducing interest expense and positioning the business for significant long-term growth. In addition, Maker’s Pride is emerging with approximately $600 million of liquidity, including $200 million of new money through an Equity Rights Offering and approximately $190 million of additional capital from a new asset backed loan facility. Maker’s Pride moves forward as a well-capitalized company under the majority ownership of a group of its existing lenders, including funds managed by Apollo and Oaktree Capital Management”
Implus Footcare is a larger investment which is held by GBDC with a previously extended maturity from July 2024 to July 2025 and continues to be marked lower (currently at 63% of cost). However, GBDC did not put this investment on non-accrual status during Q4 2024.
The amount of higher-risk Grade 1 and Grade 2 credit-rated investments remains low at 2.8% of the portfolio fair value and likely includes many of the previously discussed watch list investments. The weighted average grade of the portfolio at fair value remains 3.1.
The following table shows the previous list of ARCC's watch list investments (as of December 31, 2024), before the recent changes in tariffs, which will be taken into account with the updated ARCC Deep Dive report. As mentioned earlier, its watch list investments in Continental Acquisition and Pathway Vet Alliance were added to non-accrual during Q1 2025.

During Q1 2025, ARCC’s net asset value (“NAV”) per share declined by $0.07 or 0.4% (from $19.89 to $19.82), partially due to unrealized losses from its SDLP and non-accrual investment in Implus Footcare, contributing around $0.09 per share of losses.
Q. “On the unrealized marks in the quarter. Can you talk about whether those were kind of broad-based or more asset specific that led to the marks?”
A. “The latter, a little more asset specific. And again, not really anything that is drawing any kind of trend that we can identify just a little more esoteric one-off.”
There were smaller markdowns in multiple companies, mostly offset by over-earning the dividend by $0.02 per share (after tax), accretive share issuances at a 12% premium to NAV per share, and additional gains from its investment in Potomac, likely due to the recent sale to Blackstone (during Q1 2025). Please note that its equity position in Potomac is now valued just over $435 million (compared to cost of $211 million), potentially resulting in $0.33 per share of realized gains in 2025.
There's a couple of names and you've seen the value gone up. As those realized, that would get added to our taxable income and our realizable spillover income We believe our meaningful taxable income spillover provides further long-term stability for our dividends.”
Q. “Is that -- like I say, is there more potential for that more visibility? Or again, is that a general comment?”
A. “I mean we can't comment on specific transactions, but I think there's a couple you've probably seen can -- the pattern of it going up over time. And our hope is that a couple of those can get realized this year.”

As shown below, Q1 is typically a slower quarter for net fundings and net commitments:

As mentioned in the weekly updates, yield spreads have recently widened, which will drive higher yields on new BDC investments and/or tighter protective covenants (safer loans) over the coming quarters, which is excellent news for supporting dividends to shareholders. This is another reason I have not made additional purchases of BDCs with higher amounts of leverage (less potential portfolio growth).

ARCC management discussed this on the recent call:
“The widening of secondary market spreads in the broadly syndicated loan and high-yield markets, which began in Q1 has intensified in April amid heightened capital markets volatility. In direct lending, we are actively engaged in pricing discussions on new transactions, tightening terms and documents and positioning ourselves strategically in ongoing discussions with potential borrowers. We have been busy with ongoing discussions with borrowers and our backlog remains healthy. Our total commitments through April 24, 2025 was $0.5 billion, and our backlog as of April 24, 2025, stood at $2.6 billion.”
“We've already started to see some movement wider in overall yields between spread and fees in the last 4 weeks or so since the volatility started. So I think that's one data point that shows that the market is already starting to move. I think you can look back at history also as some guide as to what we might be able to expect going forward. And our market lags a little bit on the liquid markets, but we saw spreads obviously widen materially through that period as those flows begin to change and as our market adjusted. So I think the effect of the flows into the private BDCs and overall kind of retail flows generally don't have a material effect on the overall market. We originate across all different asset classes as well as in the nonsponsored universe and have a lot of different ways to source deals. So I think we feel pretty good about our ability to outperform our competitors. So I guess time will tell. But again, we've already started to see a little bit of widening just in the last.”
“I'd say there's been a slight movement for the better on fees in the last 4 weeks, but we'll have to see. Again, looking at the past as a guide, when we go into periods of volatility and again, looking back at the most recent period, 2022 and 2023, we saw fees move materially wider again, past doesn't always predict the future, but that has been what we've seen in the past.”
The amount of payment-in-kind (“PIK”) interest income decreased from 7.4% to 6.8% of total income, with an average of around 6.6% over the last 8 quarters, which is below the average for the sector. However, a good portion of it is related to “larger junior capital investments” as ARCC has been investing in larger middle-market companies. ARCC has an excellent history of credit quality and continues to invest in larger companies that would likely outperform, so a higher amount of PIK is acceptable, but I will continue to watch over the coming quarters.
“We've seen spread compression, I would say, in the larger names that are cash pay. And then a lot of what's available on the junior side today in the higher rate environment, frankly are non-cash, i.e., all PIK junior transactions. And we find a lot of them to be attractive. We're doing some. We're obviously conscious of the percentage of PIK income at the company and wanting to have that not kind of grow from here.”
“90% of our PIK income was structured at the time of the investment versus only 10%, which is amendment oriented PIK. We do a fair amount of junior capital investing at this company, and we think we do it quite well. And a portion of that is particularly in a higher interest rate environment, being able to structure deals that have PIK components. That's why we win business in a lot of these circumstances. And we're doing them in what we think are really high-quality companies that simply are needing to adjust to the higher rate environment and having less cash on hand. So the answer to your question is most of the PIK income is by choice, as I describe it, not as a concession for a portfolio company underperformance. It's very different from obviously where we were in 2000 where most of it was coming as a concession to companies that weren't open and weren't generating cash. But I think a lot -- in the BDC world is made of PIK and we spend a lot of time looking at the numbers. The number that I look at is just what percentage of your total interest and dividend income is PIK, right? And the number that I'm looking at for this quarter for the company is down pretty substantially from 2020, 2021 and 2022. So it just doesn't give me a significant amount of concern today because, again, most of this is by choice and part of our investment philosophy, and I think has been one of the reasons we've been able to generate such significant ROEs in, frankly, this company relative to some of the competition.”
Its debt-to-equity ratio decreased slightly to 0.97 (net of $647 million in cash) due to the issuance of 17.2 million shares (accretive to NAV) through its “at the market” ATM equity program, raising total net proceeds of $384 million.
“We ended the quarter with conservative balance sheet leverage and significant dry powder to make new investments in a potentially improving spread environment on new loans. Secondary loan markets experienced increased volatility and widening spreads and most banks have transitioned into a risk-off position. Against this backdrop of increased volatility and tightening credit conditions, the direct lending market has remained open and continues to exhibit greater stability than the liquid markets. Once again, certain transactions that previously would have gone toward the broadly syndicated loan market have instead begun to explore private credit solutions. While it is likely that some market participants will take a pause on launching new M&A processes and the overall level of M&A going forward could be slower than anticipated. We believe we are well positioned to take market share among the transactions that do occur. Periods like this have also historically produced attractive financing opportunities to support take private transactions, spin-offs and other strategic initiatives. Capitalize on all of these opportunities, we leverage our long-standing relationships and market reach to source opportunities while also supporting our existing portfolio companies.”
Q. “Going forward if the origination volume doesn't pick up, do you slow down the ATM? And how do you manage your earnings against the rising cost of liabilities? I know you only have 1 more maturity this year, but you have another couple in early next year that they're going to raise the cost of your liabilities.”
A. “Starting with deal flow. Yes, look, it's -- obviously, we're going in an interesting time, and it's hard to predict. Again, I'll try to point to some data points of things that we've seen in the last 4 weeks, which is of all the processes that were kind of in the works and heading toward a conclusion when all of this volatility began and Liberation Day began, I'd say almost every single one of those processes continue to their conclusion and did not get pulled i.e., the seller didn't decide not to sell or the buyers didn't walk. They got to signing. And I think that's a testament to the direct lending market being open and filling in for the banks, which kind of stepped back, and we were able to be there and allow those transactions to get to conclusion. Again, at somewhat wider spreads and fees. I think we saw those deals as they approach their conclusion, at least in our portfolio and in our deals that we were working on yields kind of improved by 25 to 50 basis points between spread and fee. And so that's at least some sign that deals are going to continue to get done. We obviously reported a pretty healthy backlog going into the quarter. So that provides, again, a little more tailwind. After that, as I said in the prepared remarks, it's a little bit uncertain, and it certainly could be the case that new processes don't get launched and people sort of take a pause -- in that environment, we've sort of proven that we have lots of other ways to source transactions.”
Q. “Well, if the deal flow doesn't emerge, what's in the playbook, slow down the ATM sales, how do you manage your earnings against rising cost of liabilities over the course of the next year. It's sort of step 2 of where step 1 gets you.”
A. “I think we're going to see how this plays out. Obviously, we still do have a fair amount of liabilities that are locked in for a longer period. So that's not like that's all going to unwind at one time. And I think you have to remember that there are natural offsets that occur in the market. Again, going back to our 20-year history here, we've seen in the past, lots of periods of time where interest rates were near 0 or deal flows slowed down. And we've been able to, over that 20-year period, generate a pretty darn consistent ROE in the 9% to 12% range. Today, we're around 10%. We've never really dipped below 9% over that 20-year period despite going through all different types of economic environments. And historically, we've seen that when base rates fall, spreads widen. Second lien opportunities become more available as the broadly syndicated market executes more on some of those lower-priced first lien deals. We obviously have been operating at a very low leverage ratio below 1x, low end of our range. That's a lever that we could pull to help with the earnings profile. Ivy Hill is currently at a pretty low level in terms of our portfolio mix. We're around 6% or 7% today. We've been up above 10% before. I think Ivy Hill could see some interesting opportunities to grow. And we obviously have a lot of spillover income as well that we can dip into. So there's all these different factors. Again, it's hard to predict what's going to happen, but I think we feel good about our ability to manage through that environment.”
So far in Q2 2025, the company has made new commitments of only $492 million, and there have been exits of around $394 million:

ARCC management discussed tariff-related exposure on the recent call:
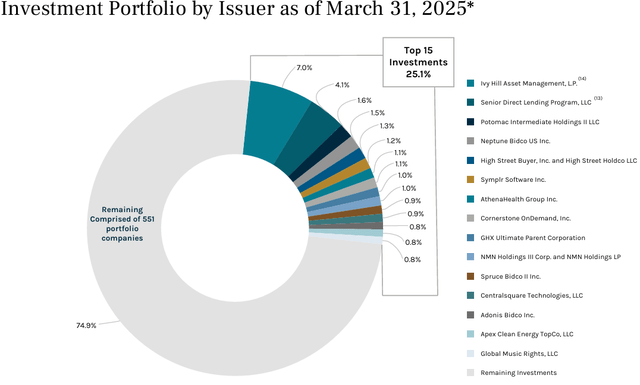
“We believe our long-standing underwriting strategy of focusing on market-leading companies with high free cash flows and what we believe to be resilient, service-oriented industries will be important drivers of stability and differentiation in the quarters ahead. We believe another point of differentiation is our disciplined approach to risk management and portfolio diversification. With 566 portfolio companies at the end of the first quarter and an average position size of less than 0.2% of the portfolio on average, we are able to mitigate the impact of negative credit events in any one company or industry.”
“During periods of market volatility and economic uncertainty, we initially focus inward by proactively assessing current and future economic impacts to our existing portfolio companies. We also positioned the balance sheet to be even more flexible with strong levels of liquidity and modest leverage. We then over-communicate with market participants to ensure they know we are open for business, and ready to partner with them. We remain confident in ARCC's ability to successfully navigate future market conditions as we believe Ares has one of the most seasoned and experienced investment teams in the industry. Our investment committee members have been investing together at Ares for over 16 years on average, which fosters a consistent approach to credit quality and portfolio construction. Furthermore, all 4 of us on ARCC's executive management team have been at Ares since before the great financial crisis.”
“Our portfolio quality, when comparing our current position to our position just prior to COVID, the last major challenging economic period. Our portfolio companies today have 17% lower loan-to-value ratios on average, underscoring the greater equity value beneath our positions today than at the year-end 2019. Our portfolio has also become even more diversified as the number of companies in our portfolio has increased by 60% to 566. As a reminder, our portfolio performed very well through COVID with lower nonaccruals, lower realized losses and better ROEs than BDC peers on average over the course of 2020 and 2021. In addition to our strong performance through COVID, we are one of the few BDCs that operated under the severe stress of the great financial crisis from 2007 to 2010, and one of an even smaller subset that did that so successfully. In addition to our distinct competitive advantages, we believe a key driver of this performance across cycles is also our flexible mandate that allows us to opportunistically invest across the capital structure.”
“The health of our portfolio can be seen in the 12% weighted average LTM EBITDA growth of our portfolio companies, which increased modestly from 11% in the prior quarter and was broad-based across both industries in which we invest and the various company size ranges. Another measure highlighting the health of our portfolio is the low leverage of our underlying portfolio companies. At 5.7x debt-to-EBITDA, this weighted average leverage level is the lowest we have seen since the first quarter of 2020. Coupled with this, our interest coverage is strengthening, currently near 2x. Beyond that, our nonaccruals at cost ended up the quarter at 1.5%, down 20 basis points from the prior quarter. This remains well below our 2.8% historical average since the great financial crisis, and the BDC industry historical average of 3.8% over the same time frame.”
“This lower level of leverage can also be seen through our portfolio's historically low average loan to value which currently sits in the low 40% range. We also take comfort in the fact that our portfolio is focused on domestic service-oriented businesses, which should be more insulated from the direct impacts of higher tariffs. On that point, we are carefully monitoring the potential direct and indirect results of higher tariffs, and we are proactively engaging with portfolio companies to mitigate the potential impact of tariffs on our portfolio. While trade policies and their economic impacts remain highly dynamic, we only have a small number of borrowers that we believe are most directly exposed to the potential impacts from tariffs particularly those that have higher exposure to China. Specifically, these borrowers comprise only a mid-single-digit share of our portfolio today and we believe these companies are starting from a position of financial strength and flexibility. Importantly, this exposure assessment does not include any mitigants these companies can potentially implement such as adjusting pricing or the ability to transition supply chains. Additionally, our portfolio management team, one of the largest and most experienced in the industry is continuously monitoring the portfolio, and is prepared to respond quickly to potential tariff changes.”
“So we're in dialogue with those mid-single-digit percentage of our portfolio companies that are potentially exposed to tariffs. We're having conversations with them now about what they're planning to do, what their liquidity forecast looks like, how well funded are they? And obviously, we're in dialogue with the owners of those companies, which mainly are private equity firms that we've been doing business with for a long time and preparing for what we need to do. If you're the owner of the business, we expect you to contribute to the liquidity need. And if our private equity partners step up and provide liquidity, then we will help be part of that solution by offering to pick a portion of our interest for a short period of time in exchange for a premium and in exchange for that capital contribution to help these companies get through these types of periods. We did that during COVID very successfully. We saw lots of equity contributions come into our portfolio companies. Yes, we did PIK interest. Our PIK exposure went up for a short period of time, but that has all come down. And again, we weathered through that storm pretty darn well. So that's step 1 in the playbook. If the private equity owner or any owner of the business is not willing to step up, then yes, we are not afraid to own a business if we need to. We have the capabilities. We've got the portfolio management expertise and owning businesses through those kinds of cycles has actually produced a lot of gains for us over a long period of time. So we're not afraid to roll up our sleeves and do that if we need to.”
Q. “It sounds like you had done a lot of work on tariffs. If you could drill down on what you meant by exposed or impacted for the portfolio names. Is that -- is that like in the context of a percentage of EBITDA, for example, or any color you could give there?”
A. “We reached out to every single portfolio company and we're in touch with them on a regular basis, obviously. We did do the work to create a bottoms-up analysis and really try to understand, first and foremost, which companies import products -- and then of those companies, which companies are importing products from high tariff countries. And obviously, that high-tariff country data point moves around week-to-week. But based on what we see today, there's a mid-single-digit exposure in our portfolio for those kinds of companies that are importing those products. We benefit from investing in and waiting toward domestic companies that are more service-oriented. And so that helped minimize that percentage. And then on the second part of your question, yes, this is really important. This is an exposure analysis, not an impact analysis. And we don't know yet what the actual impact will be, but I'll just say, we obviously -- we just went through a pretty significant supply chain disruption period coming out of COVID where we saw a lot of inflation and a lot of supply chain disruption. And our portfolio companies were able to pass on pricing and did pretty well through that. So that's what we mean by exposure, not impact is these companies could have ways to mitigate the exposure that they have and find ways to soften the effect.”
Q. “I appreciate the commentary on the potential tariff impact of importing goods. Have you done any analysis here? I mean I don't expect there'll be a lot of exposure going the other way, obviously, with retaliatory tariffs. I mean, as you say, services, not a lot of manufacturing and exporting, but have you done any analysis on that side to see if you have exposure to that kind of impact if those retaliatory tariffs do stick long-term?
A. “We've looked at that as well. As you said, it's very unclear as to how that's going to play out. We have minimal exposure as well on that front. I think it's interesting, right? Not only is there a potential risk factor, I guess, of exporting and retaliatory tariffs. There's also just multiple domino effects and spill-on effects of how this could play out, right? Second order impacts, third order impacts. What happens does inflation dampen consumer demand and obviously, everybody is wondering does this potentially tip us into a recession. I think all we can really do is look at our portfolio, try to quantify the first order impacts and we'll see how the rest plays out. I think what we come back to is just our conservative underwriting or every time we underwrite any new deal, we're always looking at the supply chain. We're looking at supply concentration. We're making sure that our companies don't have any material supply concentration. And obviously, we're always underwriting as if there's going to be a recession next year when we're running downside cases where credit investors, we're always worried about a recession all the time. So we just kind of fall back on that, and our experience operating through prior periods of softness. Obviously, it will be harder work if we do end up going through that kind of period, but we think we're prepared.”

Comparison of Return on Equity (“ROE”)
This information will be updated to take into account March 31, 2025, results.
The following table shows the changes in NAV per share and dividends paid between December 31, 2017, and December 31, 2024, as a simple proxy for return on equity (“ROE”) to shareholders. It is important to note that many BDCs prefer not to pay special or supplemental dividends unless necessary because they directly reduce NAV per share. Also, some BDCs purposely pay lower dividends relative to their earnings, contributing to higher NAV per share. However, this table takes this into account along with the current price-to-NAV ratios, showing that investors pay higher multiples for BDCs that deliver higher returns to shareholders.
It is important to point out that certain BDCs have been actively using their “at-the-market” or ATM offering programs to issue shares during the recent quarters. This has a larger positive impact on BDCs trading at higher premiums to NAV, especially MAIN, HTGC, CSWC, and TRIN. This service does not cover many of the lower-performing BDCs, including SLRC, BBDC, PTMN, OXSQ, PFX, and LRFC. FSK, MRCC, PSEC, TCPC, and PNNT have higher-than-average expense ratios. FSK, MRCC, TCPC, TPVG, and PSEC are Tier 4 BDCs for a reason. Excluding these BDCs, the average ROE is closer to 82%, which is excellent performance, especially for the BDCs with conservatively marked portfolio investments.

BDC Leverage Versus Portfolio Mix
The following table shows each BDC ranked by its debt-to-equity ratio net of cash and its portfolio mix. The “Other” column includes everything that is NOT first or second-lien secured debt. Certain BDCs have higher amounts of cyclical exposure and/or non-secured debt, joint ventures, senior loan programs, CLOs, or equity positions with higher external leverage. These assets rarely qualify for lower-cost credit lines and revolvers, which is why many of these BDCs have higher-cost unsecured notes as well as using less leverage to maintain credit ratings. FDUS, GLAD, GAIN, MAIN, and CSWC prefer to have a higher portion of their portfolio invested in equity positions, providing them with realized gains and dividend income to support supplemental dividends.
ARCC’s debt-to-equity ratio decreased slightly to 0.97 (net of $647 million in cash) due to the issuance of 17.2 million shares (accretive to NAV) through its “at the market” ATM equity program raising total net proceeds of $384 million.


What % of your borrowers are cash flow positive at 3/31/25?