
Google Sheets
Subscribers have access to the BDC Google Sheets with real-time updated pricing and recommendations, easy to use, and helpful in identifying actionable opportunities during market volatility. We continually assess overall BDC pricing relative to other higher-yielding investments looking for “oversold” or “overbought” conditions. This includes general sector and individual BDCs keeping subscribers up to date on potential buying opportunities.

We have included sample views for each of the following tabs discussed below:
Volatility Tab (important for building current positions)
Dividend Detail & Expectations (for each BDC)
Suggested BDC Portfolios (Risk Averse, Total Return, Recommended Higher-Yield, & High Yield)
BDC Buzz Total Returns (124 trades over the last 9 years)
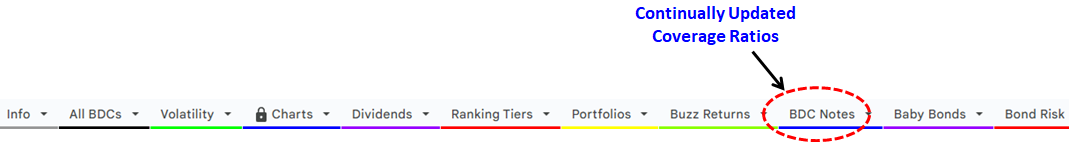
BDC Unsecured Notes (with continually updated coverage ratios)
If you would like to sign up for the BDC Google Sheets, please see the following link:
Also, you can email us directly at bdcbuzz@gmail.com.
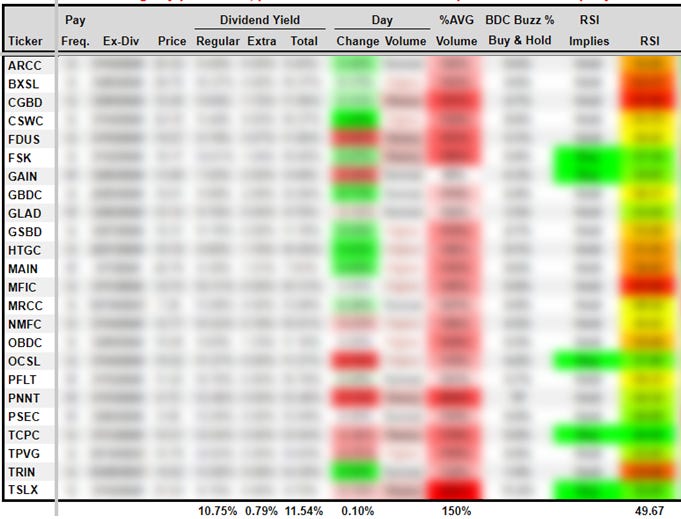
"All BDCs" Tab

The "All BDCs" tab includes the following indicators:
Recommendations for Short-Term (“ST”) and Longer-Term (“LT”) target prices
Ex-Dividend Dates
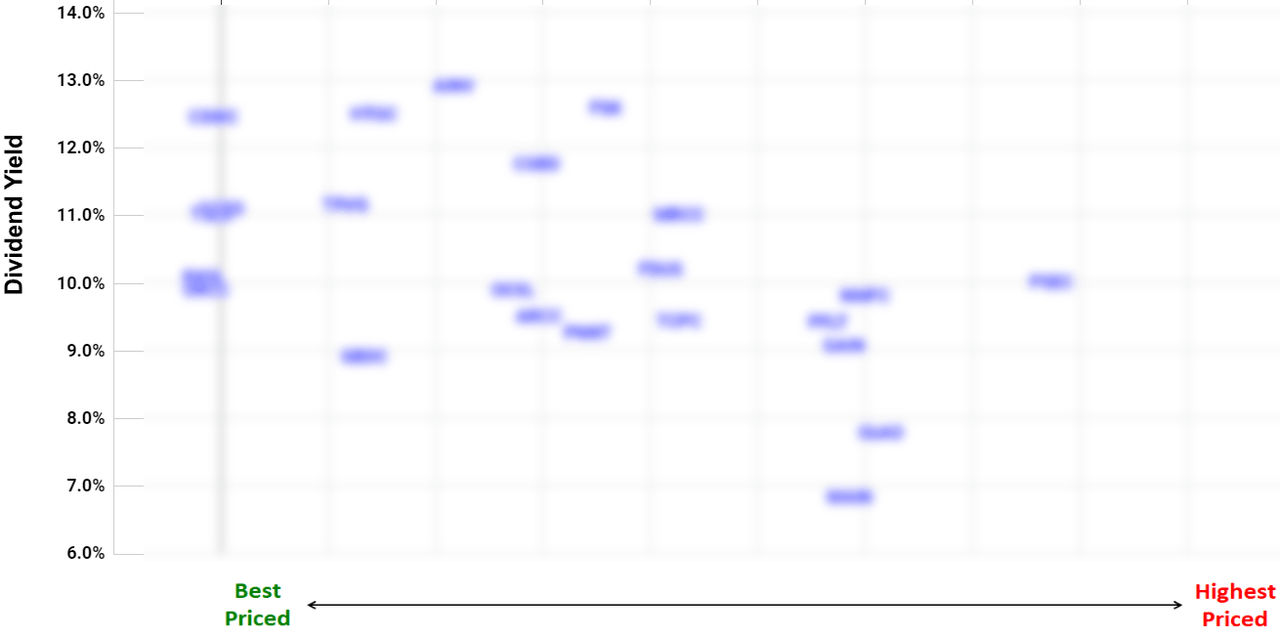
Current Dividend Yield
Trading Volume Indicator
Relative Strength Index ("RSI" discussed below)
Ranking Tiers
Current BDC Buzz Allocation
Price-to-NAV
52-Week Lows and Highs
Moving Averages (50 and 200 days)
Trading Volume
The sheets measure the average volume being traded for all BDCs to see if it is an active or slow trading day for the sector (considering the time of day) and then identify BDCs that are trading above or below that average (given the time of day). This is important because investors should know when volumes might indicate something meaningful is occurring with the stock (positive or negative).
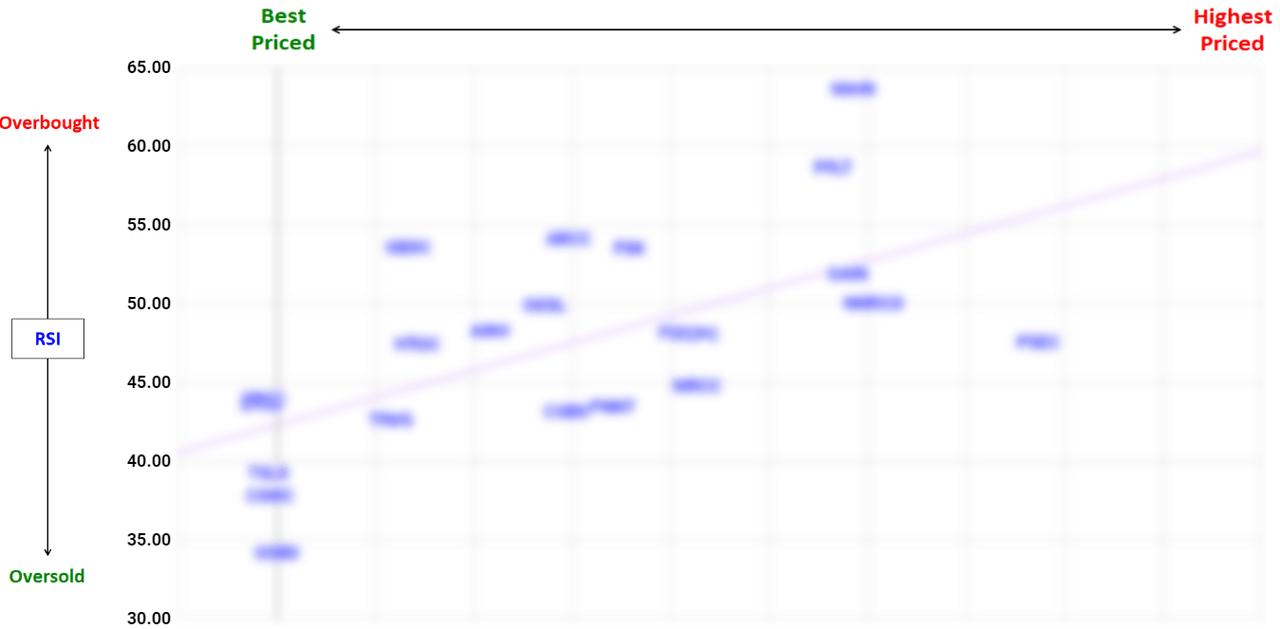
Relative Strength Index
The Relative Strength Index or RSI is an indicator that I use only after I already know which BDC I would like to purchase but waiting for a good entry point. I consider target prices to be much more important when adding to current positions. Also, I would suggest that investors ignore RSI when starting small positions and then use it for timing additional purchases to build their position. Previously added was a column showing "RSI Implies" using:
40 or below = "Buy"
41 to 69 = "Hold"
70 or higher = "Overbought"
This is a complicated formula that takes into account changes in daily pricing over a rolling 365 days. The RSI values are color-coded with green showing closer to 30 (indicating oversold), yellow showing near 50, and red showing closer to 70 (indicating overbought).

Taking Advantage of Market Volatility
The primary goal of this service is to provide timely research on mostly higher quality BDCs with realistic target prices, as well as identify which companies to buy and when to buy. We provide notices each time the BDC sector starts to pull back. Volatility is your friend, invest in higher quality, constantly monitor the fundamentals, and don't freak out when you see your investments going on sale for no reason.
Most BDCs continue to report strong results due to previously improved earnings and balance sheets, relatively low leverage, maintaining portfolio credit quality, previously reduced borrowing rates, dividend increases, management carefully deploying capital into first-lien assets of non-cyclical companies with strong covenants, etc.

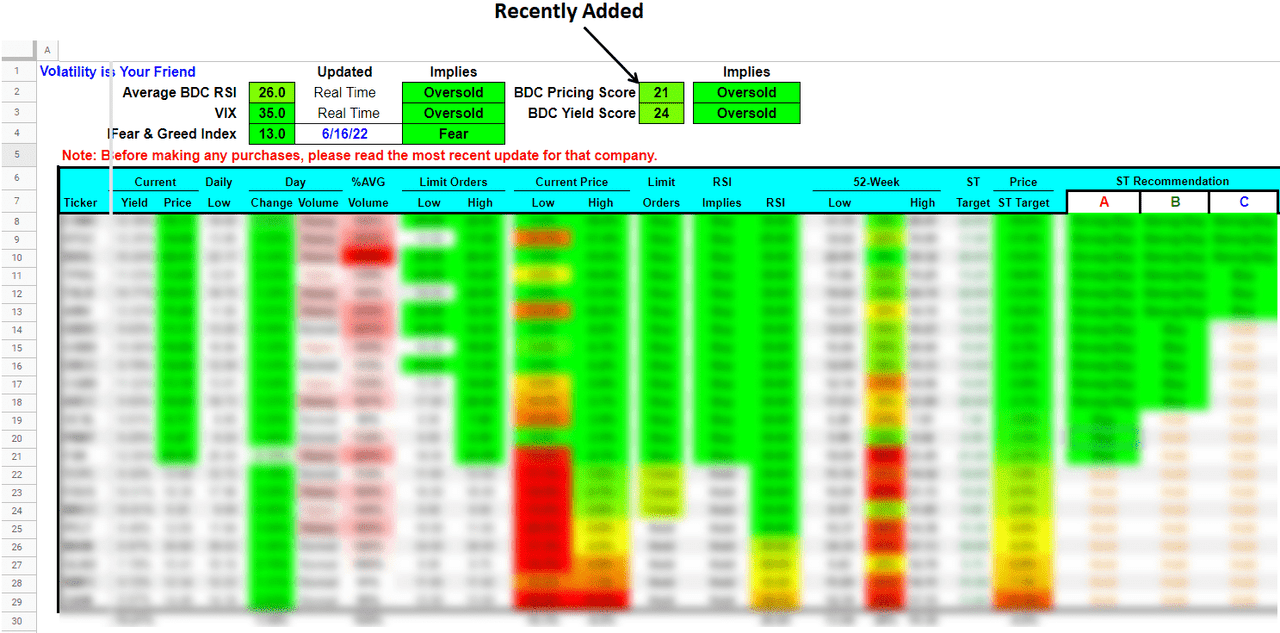
The "Volatility" tab is my personal favorite (along with the 'Charts' tab) as it displays key market indicators in real-time along with recommended limit orders, RSI, ST and LT targets, and recent/previous lows for each BDC:

The table below shows the real-time volatility indicators as well as the following details for each BDC:
Current BDC yield and price
Daily change and volume
Recommended "limit orders" for purchases
Current Price compared to the recommended 'Low' and 'High' limit orders
RSI and what it implies
ST and LT targets and current difference to the actual price
52-week lows and highs
BDC Sector Pricing Score (discussed below)
BDC Sector Yield Score (discussed below)
Recent lows (far right, not shown in this example)
BDC Buzz allocations (far right, not shown in this example)
Most important: Before making any purchases, please read the most recent update for that company.
BDCs are currently trending closer to their Short-Term (“ST”) target prices. However, BDC pricing reacts quickly and could eventually trend back to their Longer-Term (“LT”) targets again if inflation moderated to a point where the Fed took a less aggressive approach coupled with maintained economic indicators. The suggested range for limit orders is between the 'Low' and 'High', giving subscribers an idea of how low a stock can go during market volatility. Start near the high and then set other orders lower (closer to the low). Use odd amounts, like $0.01 or $0.06.
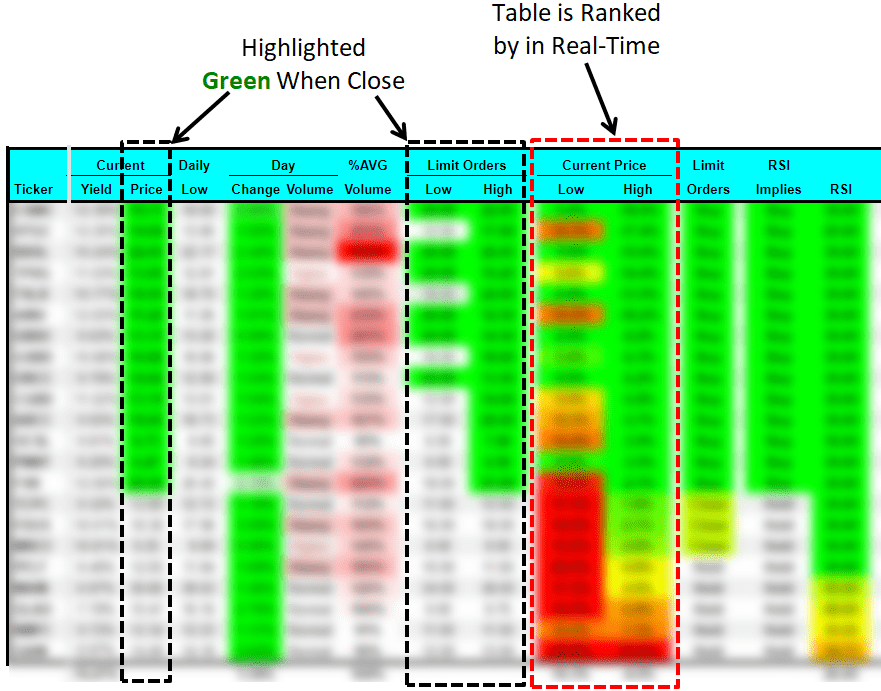
The table is ranked in real-time using the ‘Current/High Buys’ column, which shows the current price compared to the suggested ‘High’ limit order price. This means that better deals are at the top of the table. Another feature is highlighted prices for each in "green" when they are under or very close to the recommended 'Low' or 'High' limit orders.
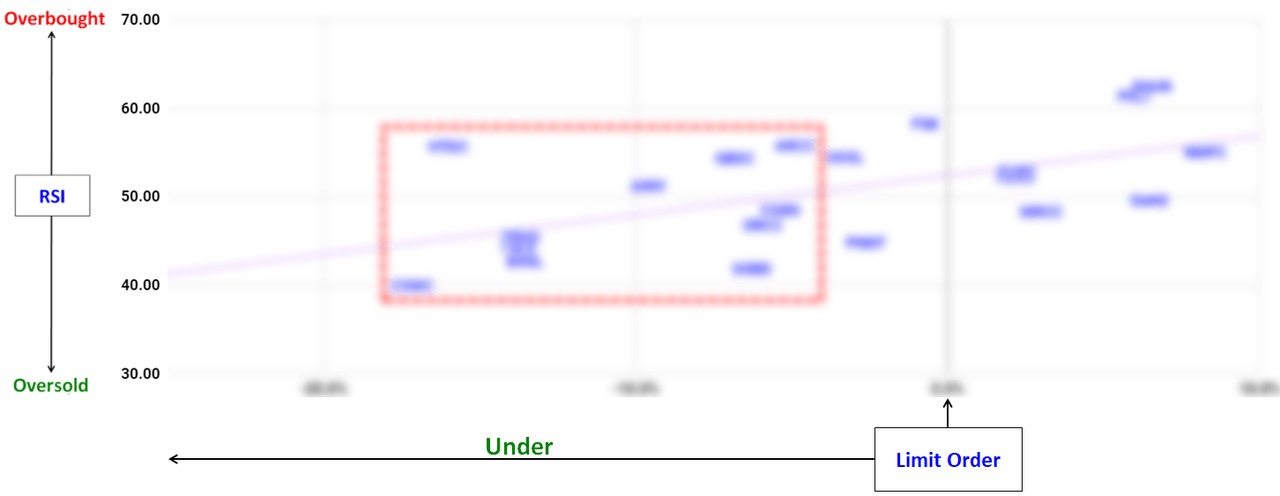
The following chart is also included on the Volatility tab using the information from the previous table to provide a visual format for finding buying opportunities.
BDC Sector Scoring System
We have developed a scoring system to keep subscribers updated on the current conditions of the BDC sector using pricing (most important), RSI (least important), and yields. This system should help subscribers identify the current market conditions for those who are using this volatility to build portfolios.
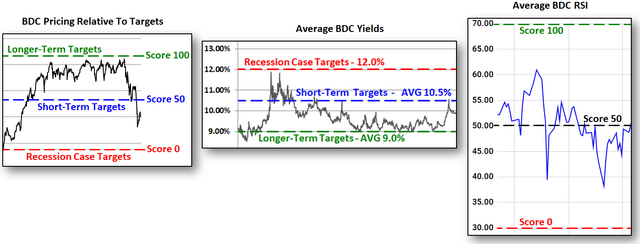
BDC Pricing Score (Relative to Targets)
Score 100 = the average BDC trading at its LT targets
Score 50 = the average BDC trading at its ST targets
Score 0 = the average BDC trading at its RC targets
BDC Yield Score
It is important to note that this analysis uses the average yield for all ~50 publicly traded BDCs, which includes lower-quality companies not covered by this service that typically have higher yields (to compensate for higher risk).
Score 100 = the average BDC is yielding 9.0%
Score 50 = the average BDC is yielding 10.5%
Score 0 = the average BDC is yielding 12.0%
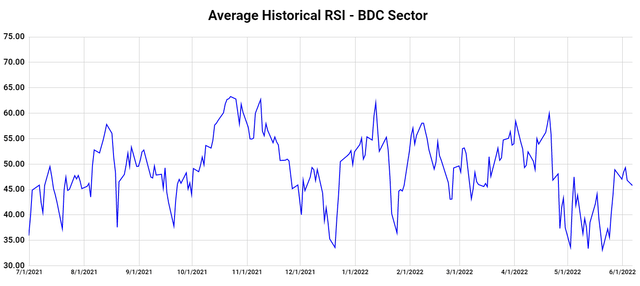
Charts to Help Take Advantage of Market Volatility
The 'Charts' tab is the one that I use the most as it provides charts to help investors take advantage of upcoming/continued volatility:


Previously added was a chart showing the Average Historical RSI for the BDC sector in real-time indicating overbought or oversold conditions. When the entire sector is oversold, there’s nothing wrong with “your stock” and it means that you may want to buy more at these levels. BDC pricing is often driven by changes in investors’ attitudes about risk.
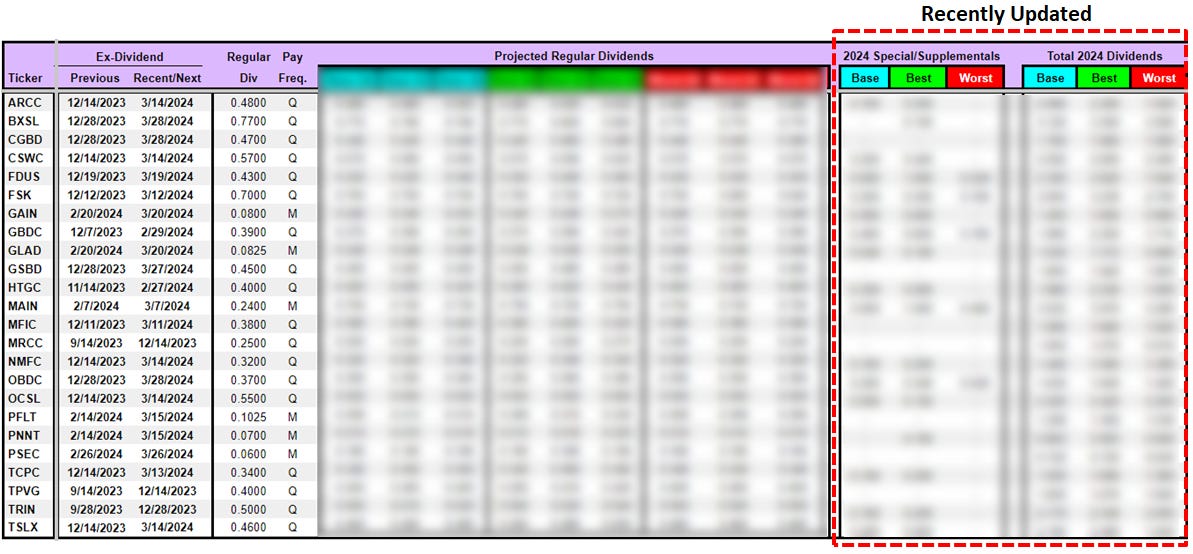
Dividend Detail & Expectations
The "Dividends" tab shows the current and expected dividends for each BDC, including the base, best, and worst-case scenarios. This information is important, as it is one of the primary drivers for target prices (along with portfolio credit quality).
This information is continually updated as the projections for each BDC are adjusted to take into account reported results:
Pay frequency
Previous and upcoming ex-dividend dates
Current regular dividend
Base, Best, Worst Case projected quarterly dividends
Base, Best, Worst Case projected special dividends
BDC Ranking Tiers
It is important to understand the Ranking Tiers are based on a relative basis, meaning that just because a company is ranked as 'Tier 2' or 'Tier 3' does not imply that it is a 'bad' stock. I own many Tier 3 companies, some of which might be upgraded over the coming weeks. The Ranking Tiers combine the results from many of the reports available at the link provided earlier and are primarily responsible for driving the target pricing assigned to each BDC focused on capital preservation, including NAV per share stability and portfolio strength, to sustain dividend coverage.
This includes the ability of the portfolio to retain value during an economic downturn. One of the best approaches to assessing risk in a BDC portfolio is using a “vintage analysis” that takes into account many aspects including the time frame that each loan was originated as well as asset class, maturity, directly originated vs. syndicated, industry sector, PIK vs. cash yields. BDCs that were lending during times of less protective covenants and higher leverage multiples while maintaining higher-than-average yields will likely have upcoming credit issues regardless of the overall economy
Assessing which vintages are potentially riskier than others is an evolving art and there are a few key indicators that I use, including historical market liquidity levels, default rates, leverage multiples, and covenant light trends. More importantly, I compare the cash/PIK yields of each loan by the time frame that they were originated, but also taking into account the asset class and company sector. Specifically, I am looking for “above market” yields that could imply higher risk. Another important indicator is loans that should have been refinanced at lower rates and are past their “prepayment penalty” windows. This would include loans with much higher than current market yields and could easily be refinanced unless the portfolio company has potential credit issues.
The “Debt-to-Equity” ratio excludes cash, which is important for BDCs with meaningful amounts of cash relative to their borrowings. For example, FDUS had a debt-to-equity ratio of 0.81 as of December 31, 2023, but excluding cash is 0.61, which is the lowest in the BDC sector.
Payment-in-kind (“PIK”) is a feature where the interest is added to the principal balance of the loan (referred to as capitalized) instead of being paid to the lender in cash (called cash-pay interest). These payments show up as income, capitalized on the balance sheet, and then paid in cash at some point. PIK loans give the borrower a chance to delay making payments in cash but typically at higher rates with strong protective covenants (that could drive higher fee income). It is important to point out that most BDCs are continually collecting the PIK portions in cash. We have categorized each BDC based on the amount, quality, and trend or direction of PIK. The amount is based on the percentage of total income. The ‘quality’ takes into account the specific credit quality of the loans with PIK features, historical collection in cash and credit performance, and quality of management. The ‘trend’ simply refers to the general direction of PIK as a percentage of total income with ‘Lower’ implying a recent reduction. Most of this information is discussed in the Deep Dive Projection reports for each BDC. We have added this information to the ‘Ranking Tiers’ tab (as shown below).
The last line in the projected financials (included in the Deep Dive Projection reports for each BDC) shows “Operating Cost as a Percentage of Available Income” which measures operating, management, and incentive fees compared to available income. BDCs with lower operating expenses can pay higher amounts to shareholders without investing in riskier assets.
“Available Income” is total income less interest expense from borrowings and is the amount of income that is available to pay operating expenses and shareholder distributions.
Also, the quality of the credit platform and management is critical when determining which Tier is assigned to each BDC.

Suggested BDC Portfolios

Risk-Averse:
This portfolio is for investors focused on capital preservation (especially during a recession) and seeking less volatility along with solid dividends. These BDCs typically have lower-than-average yields due to lower-yielding and safer investments. Many of these companies have lower fee structures to ensure dividend coverage with safer investments. Many of the lower-risk BDCs have higher pricing multiples contributing to lower-than-average yields, but during recessions, they tend to outperform the others with less volatility and still pay a healthy dividend with long-term capital appreciation.

Total Return:
This portfolio is appropriate for longer-term investors focused on tax-adjusted returns from dependable regular dividends and the potential for special dividends as well as long-term capital appreciation from increased stock values. Overall returns will probably be higher and have more favorable tax treatments (depending on the year, changes frequently for some). However, many of these BDCs are also priced at a premium with correspondingly lower dividend yields and may involve more risk due to higher amounts of equity investments needed for NAV per share growth and the potential for realized gains to pay special dividends.

Recommended Higher-Yield:
This portfolio could also be called ‘Cruising Altitude BDCs’, meaning that most of these BDCs have reached a fully ramped dividend (Level 2) and are now focused on portfolio maintenance. These BDCs may have lower dividend coverage potentially supported by management willing to waive fees to ensure coverage, hopefully giving them more sustainable dividends than other higher-yielding BDCs. I will be making changes to this portfolio mostly based on pricing and updated projections included in the Dividend Coverage Levels report.

High-Yield:
This portfolio could also be called ‘Underdogs’ and is for investors who are willing to take on more risk with less capital appreciation (over the long term), but higher dividend yields. These stocks usually have higher volatility, offering the potential for higher returns depending on investment timing. Most of these companies trade at lower multiples, typically at a meaningful discount to NAV.
If you would like to sign up for the BDC Google Sheets, please see the following link:
Also, you can email us directly at bdcbuzz@gmail.com.
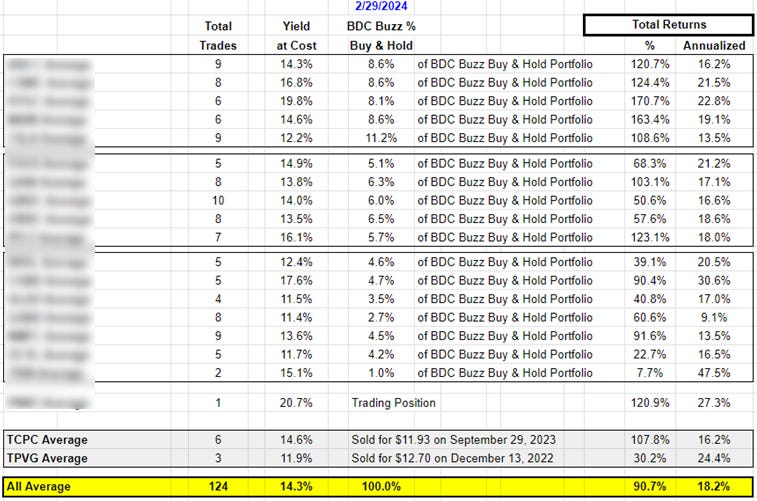
BDC Buzz Total Returns
We continually update the “Buzz Returns” tab, which shows the total returns from my recent and previous trades:

My annualized returns are currently over 19% partially due to making purchases during general market volatility, as discussed in the Upcoming BDC Buzz Purchases report. The “Annualized” return shown does not use a simple average but shows the actual compounding of annual returns. This is the true return each year.
Please note that the details for each of the 124 trades over the last 9 years are included below the table, showing the total returns, all of which are in positive territory after taking into account the dividends paid.
As discussed in previous updates, I sold my positions in TPVG and TCPC in 2022 and 2023 mostly due to having higher amounts of investments considered ‘watch list’ implying upcoming credit issues.
Tradeable BDC Notes
Many subscribers ask where BDC stocks and bonds fit into their overall portfolio. Your portfolio allocations depend on a few factors, including your age, overall risk appetite, investment time frame, and need to access capital. Historically, investment advisors used the “100 minus your age” axiom to estimate the stock portion of your portfolio. However, that was likely when the average life expectancy was 65 to 70 compared to the current 85 or higher depending on many factors, and has been revised to 120. For example, if you're 60, 60% of your portfolio should be in stocks and the other 40% in safer investments including bonds. However, it also depends on your overall risk appetite, investment time frame, and need to access capital.
BDC stocks are for longer-term investors so please allow an investment time frame of at least three years as compared to their bonds which are appropriate for longer and shorter term positions. Also, bonds provide reduced price volatility during market drawdowns, outperforming other higher-yield assets during market sell-offs.
Around 40% of my portfolio is in corporate bonds (mostly with BDCs). The following charts use the oversimplified asset classes of cash, treasuries, corporate bonds/notes, other stocks (general market equities), and higher-yield investments (including BDCs/CEFs/REITs) along with some examples of allocations and my portfolio (not exact).

BDC bonds are attractive for many reasons including having higher yields/returns than other investment-grade bonds combined with the capital protections provided by the unique structure of BDCs. Also, given my focus on the risk and quality of BDC common shares, I have an intimate understanding of the risk and quality for bondholders. The following are some options that management teams have before potentially defaulting on a debt obligation:
Reducing leverage by not reinvesting repayments from portfolio companies
Reducing the dividend to common shareholders
Reducing or waiving management and incentive fees
BDCs have permanent equity capital (no "runs on the bank" to force the liquidation of undervalued assets)
Raising equity capital: common or preferred, even dilutive if absolutely necessary
External manager/credit platform can provide additional capital if needed
For these reasons, no BDC has defaulted on a debt obligation.
Each of the updated Deep Dive Projection reports includes the projected interest expense coverage and asset coverage ratios with best, base, and worst case. We have included this information in the 'BDC Notes' tab (discussed next) and are currently updating the projections for each BDC. Please see the following links from Investopedia for more information:
I like BDC bonds partially due to their quality and relatively shorter-term maturities, providing reduced price volatility during market drawdowns, and outperforming other higher-yield assets during market sell-offs. Most BDC bonds mature over the next 4 to 5 years which is excellent for investors given the current inverted yield curve (short-term rates higher than longer-term). Also, BDC bonds have higher yield spreads relative to other corporate bonds which would hopefully provide some cushion in case credit spreads widen again especially as they trend toward par closer to their maturity dates. Also, BDC bonds have higher yield spreads relative to other corporate bonds which would hopefully provide some cushion in case credit spreads widen again especially as the notes will be trending toward par ($100) as they get closer to their maturity dates.
ARCC, CGBD, CSWC, FSK, GAIN, GBDC, GLAD, MFIC, NMFC, OCSL, TRIN, and TSLX, have recently/previously issued new bonds/notes providing much higher effective yields and have been added. The following are some of the recently added investment-grade bonds to the 'BDC Notes' and 'Baby Bonds' tabs:
ARCC: $1.0 billion of 5.875% notes due 2029, (CUSIP: 04010LBF9)
GBDC: $600 million of 6.000% notes due 2029, (CUSIP: 38173MAE2)
NMFC: $300 million of 6.875% notes due 2029, (CUSIP: 647551AF7)
MAIN: $350 million of 6.950% notes due 2029, (CUSIP: 56035LAH7)
MFIC: $75 million of 8.000% notes due 2028 (“MFICL”)
OBDC: $600 million of 5.950% notes due 2029, (CUSIP: 69121KAH7)
TSLX: $350 million of 6.125% notes due 2029, (CUSIP: 83012AAC3)
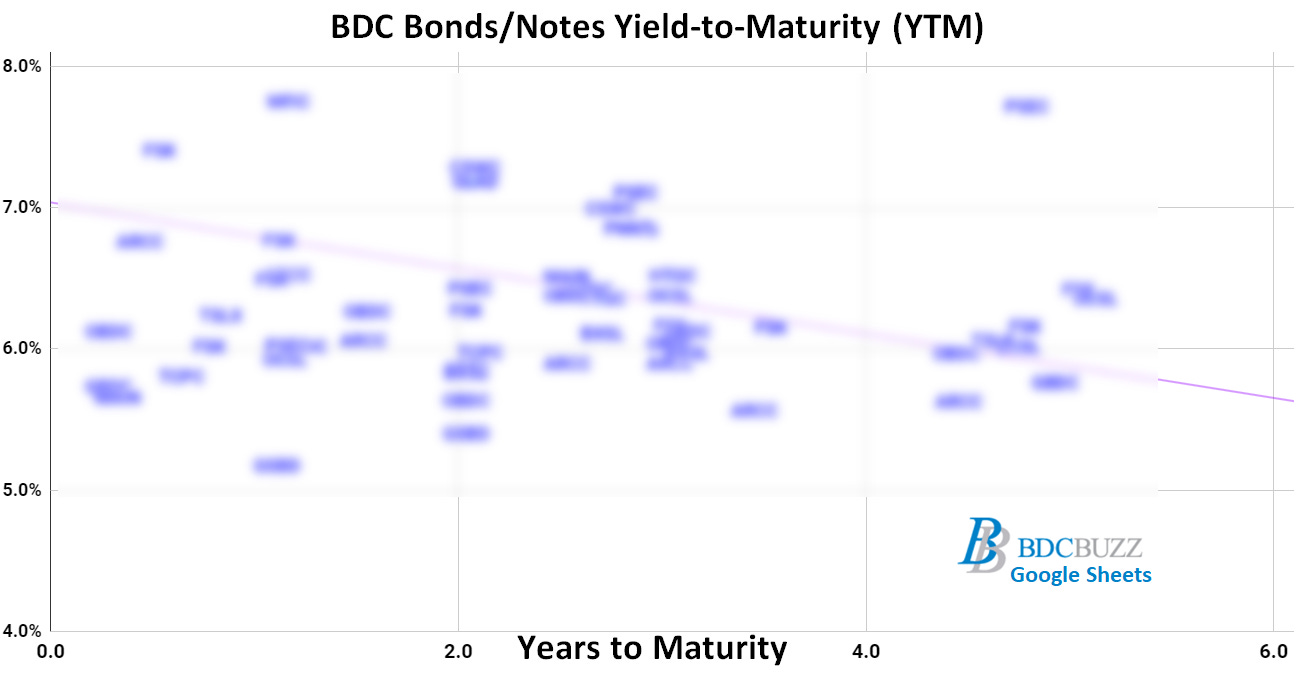
One of the most important considerations when investing in bonds is trading volumes which can vary depending on the size of the issue and the number of traders in the market. Please use the 'BDC Notes' tab, which includes links so that subscribers can pull up the most recent trades, pricing, and yield information for each. As shown below, we have included a ‘Trading Volume’ column identifying ‘Higher’, ‘Mid’, or ‘Lower’ volumes.
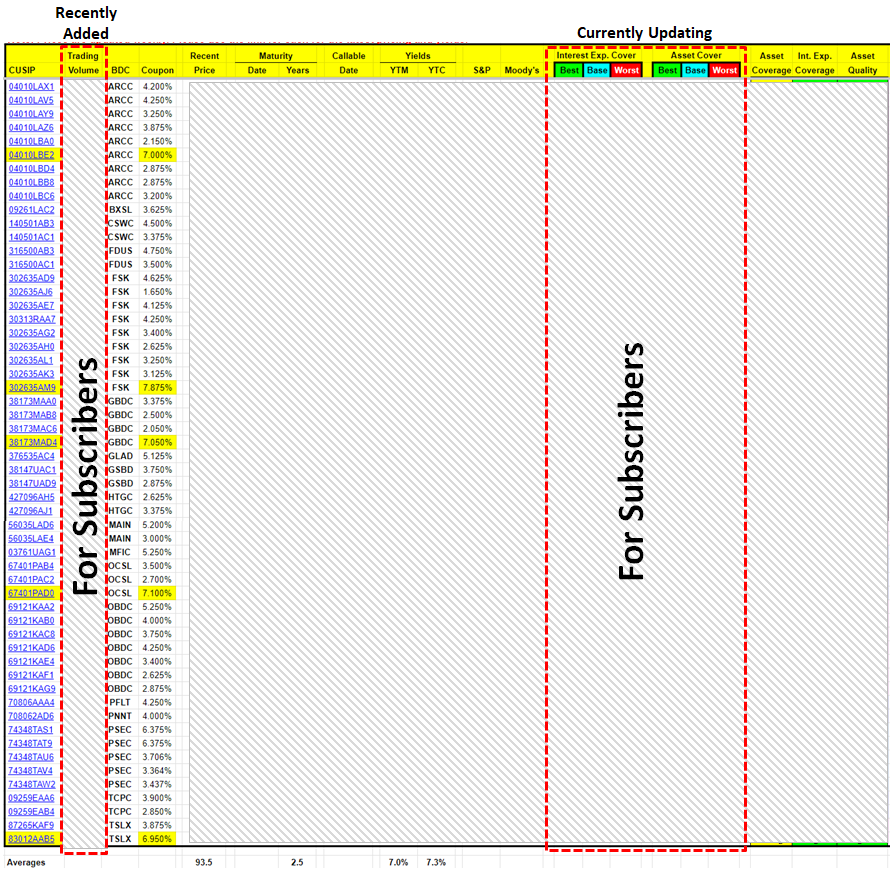
The following chart can be found just below the table, showing the current yield-to-maturity and years to maturity.
If you would like to sign up for the BDC Google Sheets, please see the following link:
Also, you can email us directly at bdcbuzz@gmail.com.
Baby Bond Sheets
The following information is included in the "Bond Info" sheet:
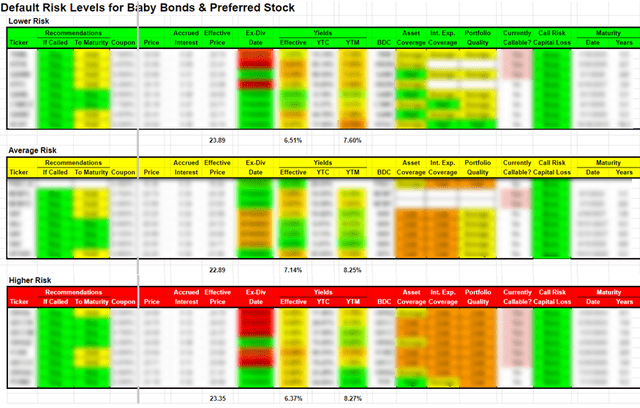
The "Bond Risk" tab is ranked by Default Risk with notification of Call Risk Capital Loss, which changes based on the current pricing.
It is important to take into account which BDCs are "callable" and the potential for capital losses during the worst-case scenario.
The Call Risk Capital Loss refers to the worst-case scenario of the bond being called tomorrow and takes into account 30 days of additional interest accrued before being redeemed.
Breakeven Days refer to the number of days of interest needed to breakeven given the current market price
BDC Baby Bonds trade "dirty" which means that there is a certain amount of accrued interest in the market price.
Investors need to own the Baby Bond one trading day before the ex-dividend date to be eligible for the full quarter of interest.
Recommendations Based on "If Called" and "To Maturity":
"If Called" - assumes that the Baby Bond is called in the near future.
"To Maturity" - assumes that you hold until maturity.
Previously we made a few changes to the Baby Bond tabs including adding recommendations based on "If Called" and "To Maturity" (discussed below) along with "Suggested Buy" prices (see below) that change daily based on accruing interest and days to call/maturity. This means if you are using them to set limit orders you need to adjust weekly as well as take into account the 'Ex-Div Date', which is quarterly and the price will probably change on the following day, which might trigger your limit order. I will discuss this in upcoming updates. This pricing is mostly driven by the "call date' as I firmly believe that the largest risk for investors is the “redemption risk”. There has never been a default on a BDC Baby Bond as there are many levers management can pull before this worst-case scenario.
The "Suggested Buy" price takes into account the call date and ensures that investors get a minimum of around 5% annual returns for lower-risk and 6% for higher-risk Baby Bonds if the company decides to redeem early (on the "Call Date" or in 30 days for the ones that are currently callable).
The recommendations change in real time based on current pricing, ex-distribution date, call/redemption date, maturity date, etc.

The "Bond Risk" Tab:

The “Bond Risk” tab includes a summary of metrics used to analyze the safety of a debt position, such as the “Interest Expense Coverage” ratio, which is used to see how well a firm can pay the interest on outstanding debt. Also called the times-interest-earned ratio, this ratio is used by creditors and prospective lenders to assess the risk of lending capital to a firm. A higher coverage ratio is better, although the ideal ratio may vary by industry. When a company's interest coverage ratio is only 1.5 or lower, its ability to meet interest expenses may be questionable.
The asset coverage ratio is a financial metric that measures how well a company can repay its debts by selling or liquidating its assets. The higher the asset coverage ratio, the more times a company can cover its debt. Therefore, a company with a high asset coverage ratio is considered to be less risky than a company with a low asset coverage ratio.
The Bond Risk tab is ranked by Default Risk with notification of Call Risk Capital Loss, which changes based on the current pricing. Also included are 'Buy', 'Hold', or 'Overpriced' indicators for each Baby Bond/Preferred that is driven by real-time pricing (taking into account accrued interest), which BDCs are "callable" and the potential for capital losses during the worst-case scenario, and effective yields. The 'Overpriced' indicator is for BDCs with a higher risk of Capital Losses mostly due to being called at current prices.
Example of How to Trade BDC Notes Using Fidelity
After you log into the Fidelity Home Page look for the tab at the top for "News & Research" (or "Investment Products") and then click on "Fixed Income, Bonds, CDs" as shown below:

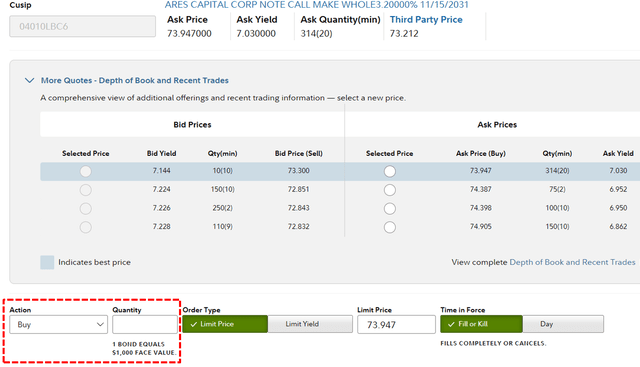
Enter the CUSIP of the Note/Bond that you want to buy. You can get the CUSIP from previous reports for each BDC or on the "BDC Notes" tab in Google Sheets.


Each bond has a detailed page showing its details (see above).
Take a close look at "Depth of Book", "Recent Trades", and "Issuer Events".
You do not have to take the listed BID/ASK; you can put in your own limit price or yield as shown below.
Keep in mind that each BDC Note/Bond is $1,000.
If you would like to sign up for the BDC Google Sheets, please see the following link:
Also, you can email us directly at bdcbuzz@gmail.com.