Assessing & Comparing Risk For Business Development Companies


Quick Summary
This article discusses the amount of ‘watch list’ investments for each BDC and the potential impact on NAV per share using various default and recovery rates.
If your primary concern is capital preservation (as compared to higher dividend yields) with less volatility and solid dividends, this article is for you.
BDCs with lower amounts of watch list investments have easily outperformed the others including recent NAV performance and long-term total returns to shareholders.
This will likely continue, which is why the Deep Dive reports continue to focus on portfolio investments that may have upcoming credit issues.
Please note that the information provided below was previously inlcuded in the following update but with additional details (watch list info for each BDC):
Over the coming weeks, we will be updating the watch lists for each BDC and discussing the changes in their Deep Dive Projection reports. You can sign up for our monthly BDC Buzz Substack platform at the following link:
Quick Introduction To Business Development Companies
Business development companies ("BDCs") invest shareholder capital in privately-owned, small- and medium-sized U.S. companies generating income from secured loans and capital gains from equity positions, much like venture capital or private equity funds. Anyone can invest in BDCs as they're public companies traded on major stock exchanges.

Also, many BDCs have investment grade ("IG") bonds/notes for lower-risk investors building a balanced 60/40 portfolio (composed of 60% to 70% stocks/equities and 30% to 40% bonds or other fixed-income offerings).

Assessing Risk for BDCs
Assessing risk is critical when setting the target prices for each BDC focused on capital preservation, including net asset value (“NAV”) per share stability and portfolio strength, to sustain dividend coverage. This includes the ability of the portfolio to retain value and earnings to support current dividends during an economic downturn.
Historical dividend coverage is a simple and basic measurement used to evaluate BDCs and for some reason typically ranks very high among certain investors. MANY lower-quality BDCs have/had excellent dividend coverage but slashed their dividends due to credit issues. Also, many of them had plenty of UTI/UNII/spillover which is “undistributed taxable income” or cumulative earnings in excess of previous dividends. This can be a dangerous metric as many investors use it as an indicator of the safety of the dividends. Nope! Around 95% of all BDCs that previously reduced their dividends had adequate excess earnings that could have been “used” to maintain the dividend for at least 1 to 4 quarters. Even BDCs with lower-quality management will cut dividends based on projected earnings which need to take into account recent and potential credit issues.
The following chart shows the importance of the various information using oversimplified categories ranging from historical/previous dividend coverage which is the least important to projected credit quality which is the most important. There are many reasons for this including changes in credit quality has a material impact on dividend coverage in multiple ways. Increased credit issues result in lower earnings (from non-accruing or loan defaults), and lower NAV per share which increases leverage ratios (reduces ability to increase borrowings) which might require the BDC to reduce the size of the portfolio. Also, there is the potential for downgraded credit ratings which drive higher borrowing rates and lower price-to-NAV ratios which further reduces the access to capital (not able to issue shares at a premium to NAV). Portfolio credit quality is the primary driver of earnings and dividend coverage.

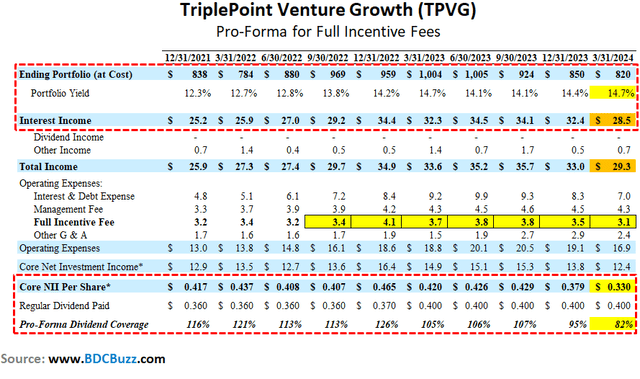
One of the most recent examples is TriplePoint Venture Growth (TPVG 0.00%↑ ) which previously had excellent dividend coverage but is now reliant on waived incentive fees. The following table shows the impact on dividend coverage if the company paid the full incentive fees over the last seven quarters. For Q1 2024, the size of the portfolio at cost declined by 4% compared to interest income which declined by 12% due to increased non-accruals. Also, there was higher-than-expected one-time prepayment-related income during the quarter. TPVG’s dividend coverage would have been closer to 82% if the company paid the full incentive fee:
One of the best approaches to assessing risk in a BDC portfolio is using a “vintage analysis” that takes into account many aspects including the time frame that each loan was originated as well as asset class, maturity, directly originated vs. syndicated, industry sector, PIK vs. cash yields. BDCs that were lending during times of less protective covenants and higher leverage multiples while maintaining higher-than-average yields will likely have upcoming credit issues regardless of the overall economy.
Assessing which vintages are potentially riskier than others is an evolving art and there are a few key indicators that we use, including historical market liquidity levels, default rates, leverage multiples, and covenant light trends. More importantly, we compare the cash/PIK yields of each loan by the time frame that they were originated, but also taking into account the asset class and company sector. Specifically, we are looking for “above market” yields that could imply higher risk. Another important indicator is loans that should have been refinanced at lower rates and are past their “prepayment penalty” windows. This would include loans with higher than current market yields and could be refinanced unless the portfolio company has potential credit issues.
The Deep Dive Projection reports for each BDC continue to focus on portfolio investments that may have upcoming credit issues and compare the amount of ‘watch list’ investments and the potential impact on NAV per share using various default and recovery rates.
What Are Watch List Investments?
We are continuously monitoring BDC portfolios to identify potential defaults, including loan performance, rating downgrades, specific company/sector news and events, etc. Watch list investments are portfolio investments that may have upcoming credit issues.
What Is the Default Rate?
The default rate measures the amount of loans that have gone into default, usually expressed as a percentage of the total amount of loans in a portfolio. A default occurs when a borrower fails to make the required payments on a loan. The default rate is an indicator of the credit quality of a loan portfolio and can be used to assess the risk of a lender’s portfolio. Default rates can be affected by various factors, including the quality of the loan portfolio, the state of the economy, and the effectiveness of the lender’s loan underwriting and risk management practices.
What Is the Recovery Rate?
The recovery rate is a measure of the amount of capital that a lender can recover from a loan that has gone into default, typically expressed as a percentage of the original loan amount. The recovery rate reflects the ability of the lender to collect on a defaulted loan and can be used to assess the risk of a lender’s portfolio. A higher recovery rate generally indicates that the lender has taken steps to minimize its losses from defaulted loans, such as securing collateral, using loan guarantees, or taking legal action against the borrower. A lower recovery rate may indicate that the lender has not taken adequate steps to protect its interests and may result in higher losses from defaulted loans. The recovery rates on first-lien secured debt positions with appropriate covenants/protections/collateral will be much higher than junior/subordinated positions.
Q1 2024 BDC Results
Our process for identifying upcoming or potential credit issues worked again for Q1 2024 with most of the BDCs with larger amounts of watch list investment experiencing the largest NAV declines for Q1 2024. Many of the BDCs with the largest NAV increases were mostly due to equity positions which can be volatile.
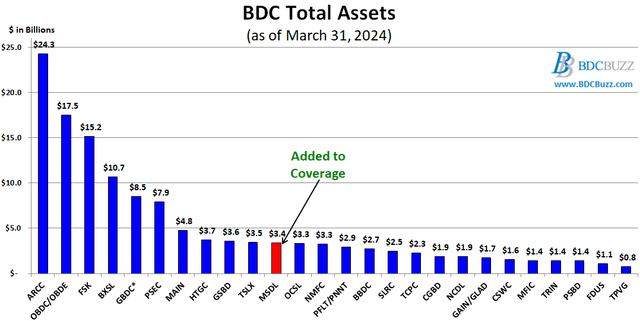
Please note that the BDC Buzz service does not cover OXSQ, BBDC, SAR, RWAY, WHF, PTMN, or HRZN. As mentioned later, we have started coverage of MSDL and have included it in the tables.
TPVG was the outlier when it came to non-accruals and now has the highest amount in the sector (passing FSK) which was expected given the previous amount of watch list investments.

Comparison of Return on Equity (“ROE”)
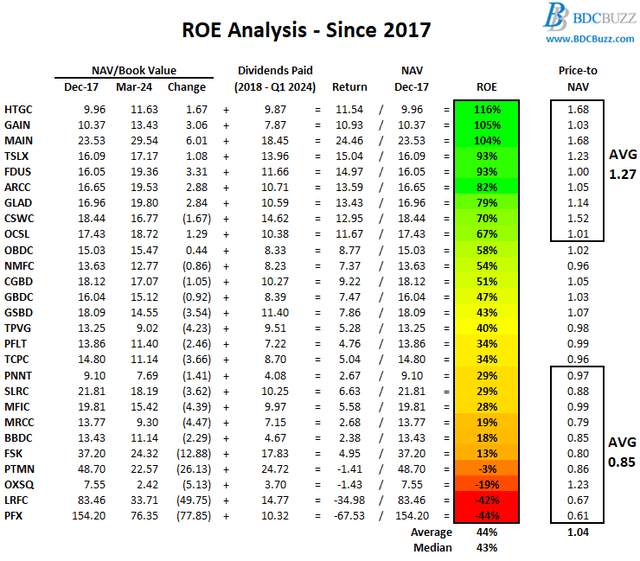
The following table shows the changes in NAV per share and dividends paid between December 31, 2017, and March 31, 2024, as a proxy for return on equity (“ROE”) to shareholders. It is important to note that many BDCs prefer not to pay special or supplemental dividends unless necessary because they directly reduce NAV per share. Also, some BDCs purposely pay lower dividends relative to their earnings, which contribute to higher NAV per share. However, this table takes these into account along with the current price-to-NAV ratios, showing that investors pay higher multiples for BDCs that deliver higher returns to shareholders. This service purposely avoided many of the BDCs with larger NAV declines and dividend reductions responsible for the lower returns including PFX, LRFC, OXSQ, PTMN, BBDC (was TCAP), and SLRC. Please note that FSK, MRCC, PNNT, and MFIC have been consistently identified as having higher amounts of watch list investments.
Most BDCs with higher ROEs have historically held higher amounts of equity investments, including HTGC, GAIN, MAIN, FDUS, ARCC, GLAD, and CSWC. However, TSLX has relatively lower amount amounts of equity positions and much higher first-lien currently around 92% but has still delivered higher returns to investors as shown below. All of these BDCs have provided investors with much higher total returns (dividends plus changes in stock price).
Watch List Categories - BDC Google Sheets
We use the BDC Google Sheets to track and communicate large amounts of information to our subscribers including buying opportunities, rankings, and various metrics updated in real-time. For more information, please see the previous update:
We previously added a column showing which BDCs have ‘Lower’, ‘Average’, or ‘Higher’ amounts of watch list investments to the ‘Rankings Tier’ tab, as shown below:

Comparing BDC Watch Lists
The following chart shows the potential impact on NAV per share for each BDC, assuming that 100% of watch list investments (including non-accruals) defaulted with 0% recovery. This is the worst-case scenario for this group of investments. It is important to note that the chart only takes into account watch list investments and any changes to other positions will also have an impact (positive or negative), especially equity positions most of which are not included in the watch lists. Subscribers who believe the economy is headed for a ‘hard landing’ with a deep, broad, and/or extended recession should focus on the BDCs closer to the top left corner.
As mentioned earlier, the largest NAV declines have consistently been BDCs with higher amounts of watch list investments including PSEC 0.00%↑ , TPVG 0.00%↑ , and TCPC 0.00%↑ . Please see the end of this update for a quick discussion of PSEC’s concentration risk and slides showing historical credit losses and default rates for select BDCs.
We have recently updated the watch list information for MSDL (discussed next) and over the coming weeks, we will be updating the other BDCs discussing the changes in their respective Deep Dive Projection reports. If you would like to see where the other BDCs rank in the chart below, please sign up for our Substack service:

MSDL Example & Quick Update
Earlier this month we started coverage of Morgan Stanley Direct Lending Fund ( MSDL 0.00%↑ ) which has relatively lower amounts of watch list investments similar to the other BDCs in our suggested ‘Risk Averse’ portfolio.
Also, MSDL has an investor-friendly fee structure combined with 95% of its portfolio invested in first-lien positions of larger companies (relative to smaller BDCs) that would likely outperform in an extended recession environment, with a relatively stable NAV and 0.0% of the portfolio fair value on non-accrual status.
“We believe that our portfolio diversification, included by loan size and industry, is a significant risk mitigation tool that is further insulated by the fact that we look to maintain diversity by selectively targeting non-cyclical industries while preserving low borrower concentration. At the end of the first quarter, our weighted average loan-to-value was 43% and the weighted average EBITDA of our portfolio companies was $155 million. Additionally, the median EBITDA of our portfolio companies was $82 million.”
MSDL has investments in 178 portfolio companies valued at over $3 billion of mostly first-lien secured debt positions highly diversified with very low concentration risk, an average investment size of 0.6% of the portfolio fair value, and the top 10 accounting for around 20%
“We think the strong performance of our middle market borrower base is an extension of that in terms of the ability to withstand elevated interest costs that are accruing to the benefit of our investors. We are not complacent about the ongoing geopolitical and macroeconomic uncertainty, but we like our defensive positioning in the market, focused at the top of the capital structure, in avoiding the deeply cyclicals.”
“The average position size of our investments was approximately $18.5 million or 0.6% of our total portfolio on a fair value basis. Further, our top 10 portfolio companies represented approximately 20% at fair value of the total portfolio.”
“Morgan Stanley investment management has approximately $1.5 trillion of assets under management with a deep history in alternatives. As of January 1, 2024, the Morgan Stanley private credit platform in the US managed committed capital of approximately $18.5 billion, $15.6 billion of which is for the direct lending platform where this company resides. There are countless benefits to our team being part of the broader platform, most notably from an origination and due diligence standpoint, which we will delve into in a bit more detail.”
During Q1 2024, MSDL’s net asset value (“NAV”) per share remained stable at $20.67 due to overearning the dividend by $0.13 per share offset by $0.08 per share of dilution related to the IPO and $0.05 per share of unrealized losses (due to its non-accrual investment in Matrix). Non-accruals declined to 0.0% of the portfolio fair value (0.4% at cost) due to restructuring Sweep Purchaser and Vardiman Black resulting in realized losses for the quarter partially offset by adding its first-lien position in Matrix Parent. Previously, its second-lien position in Matrix was non-accrual but written off during the quarter driving $0.06 per share of unrealized losses.
We had three investments on non-accrual status, representing approximately $12.4 million or 40 basis points of the portfolio at cost, which is down from 60 basis points as of December 31, 2023. Of the three investments, there was one new investment placed on non-accrual status, which was a first-lien position in Matrix Parent. Our second-lien tranche in Matrix Parent was placed on non-accrual status last quarter. There was one investment removed from non-accrual status, that being Vardiman Black, which was restructured in the current quarter.”
Its unsecured debt position in Teasdale Foods remains on non-accrual but the first-lien portion is still accruing and is included in the following table showing its ‘watch list’ investments which likely include the Risk Rating 3 credit-rated investments.
“With respect to our internal risk ratings, as of March 31, 2024, over 98% of our total portfolio had an internal risk rating of 2 or better, which is unchanged.”

Many of the larger watch list investments, which are not on non-accrual, remain marked over 80% of cost and the current watch list is around 7.7% of the portfolio at cost (6.6% at fair value) which is lower than most BDCs. Payment-in-kind (“PIK”) interest income currently accounts for under 3% of total income and includes many of the investments listed below (see ‘Partial PIK’).

The following table shows the potential impact on MSDL’s NAV per share using a range of default rates only for its watch list and non-accrual investments, but also considering a range of potential recovery rates.
For example:
If 100% of these investments defaulted with a 0% recovery, the negative impact on NAV per share would be around $2.45 or 11.8%. This is the worst-case scenario for this group of investments.
If 50% of these investments defaulted with a 50% recovery, the negative impact on NAV per share would be around $0.51 or 2.5%.
If 20% of these investments defaulted with an 80% recovery, there would be relatively little impact on its NAV per share.
It is important to understand that MSDL’s watch list (includes its non-accruals) is currently marked at an average of 85% of cost. Any changes to other investments will also have an impact (positive or negative).

Slides Showing Historical Credit Losses and Default Rates
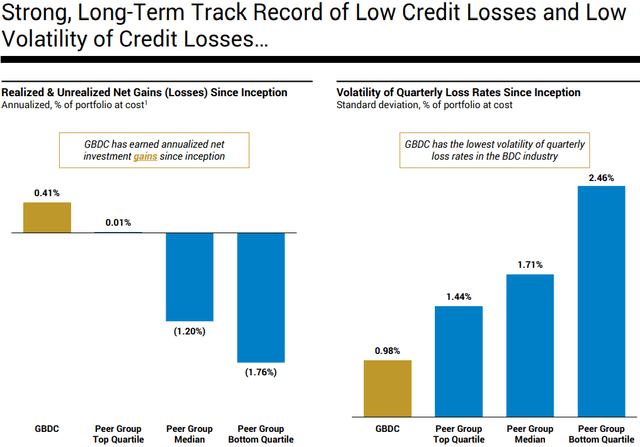
Historically, higher-quality BDCs have easily outperformed other lenders (including banks) during recessionary environments for a host of reasons, including having permanent equity capital, much less cyclical exposure, and more flexible lending abilities/tools that will be discussed in upcoming reports. Even in a worst-case scenario, higher-quality BDCs can restructure investments to protect capital over the longer term. The following slides are from an ARCC presentation comparing returns/performance since 2004:


Also, most BDCs have increased their dividends to easily achievable levels and will likely retain excess earnings to offset capital losses from increased defaults/credit issues. Please understand that this is a normal part of the lending cycle:
“Of course, a weakening economy will create some portfolio issues. We do not expect to nor will be perfect. We will see some challenges and could see defaults tick up from the current levels, which are at historical lows. However, we believe these issues will be manageable and the significant increase in earnings we are experiencing will more than offset any modest pickup in losses.”
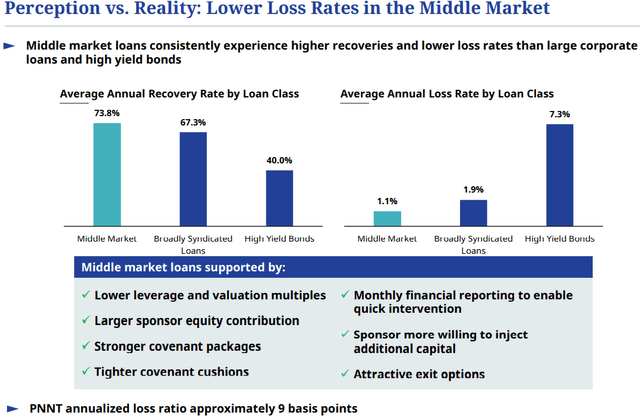
The following slides are from multiple BDCs:

PSEC Portfolio Update
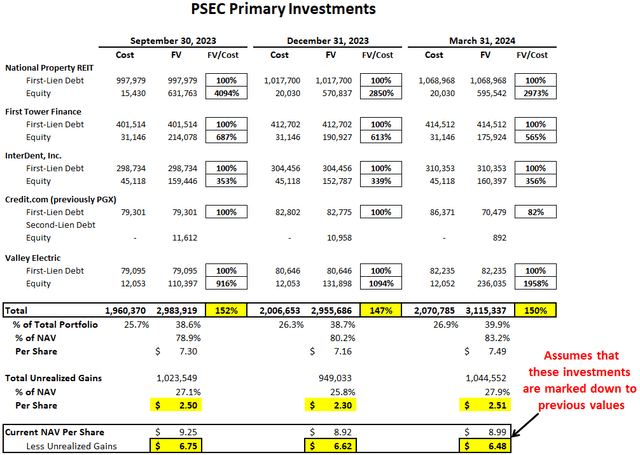
National Property REIT, First Tower Finance, InterDent, Valley Electric, and Credit.com/PGX, still account for $3.1 billion, or 40% of the total portfolio, and over 83% of NAV per share (as shown below). This is a very high concentration risk, especially if management uses aggressive valuation measures. The following table shows the total amount of unrealized gains remains over $1 billion, which has added $2.51 to its NAV per share even after taking into account the previous markdowns. If these investments were marked back down to cost, the current NAV per share would decline from $8.99 to $6.48.
During an economic recession, this is a possibility for some of these investments, and investors should be prepared for a certain amount of markdowns. In September 2023, PGX underwent a corporate restructuring with the new borrower being Credit.com Holdings. As part of the transaction, the first-lien term loan was restructured into new debt, resulting in a realized loss of $1.5 million, and the second-lien term loan was written off resulting in a realized loss of $180.0 million. In connection with a Chapter 11 process, PGX sold the majority of its assets to Credit.com Holdings, and PSEC was issued equity at Credit.com, through its Class B non-voting equity investment in PGX Topco. Please note that its first-lien position in Credit.com was recently marked lower to 82% of cost: