Assessing BDC Risk
Assessing Risk For BDCs
Assessing risk is critical when setting the target prices for each BDC focused on capital preservation, including NAV per share stability and portfolio strength, to sustain dividend coverage. This includes the ability of the portfolio to retain value during an economic downturn.
One of the best approaches to assessing risk in a BDC portfolio is using a “vintage analysis” that takes into account many aspects including the time frame that each loan was originated as well as asset class, maturity, directly originated vs. syndicated, industry sector, PIK vs. cash yields. BDCs that were lending during times of less protective covenants and higher leverage multiples while maintaining higher-than-average yields will likely have upcoming credit issues regardless of the overall economy.
Assessing which vintages are potentially riskier than others is an evolving art and there are a few key indicators that we use, including historical market liquidity levels, default rates, leverage multiples, and covenant light trends. More importantly, we compare the cash/PIK yields of each loan by the time frame that they were originated, but also taking into account the asset class and company sector. Specifically, we are looking for “above market” yields that could imply higher risk. Another important indicator is loans that should have been refinanced at lower rates and are past their “prepayment penalty” windows. This would include loans with much higher than current market yields and could easily be refinanced unless the portfolio company has potential credit issues.
BDC ‘Watch Lists’
The Deep Dive Projection reports for each BDC continue to focus on portfolio investments that may have upcoming credit issues and compare the amount of ‘watch list’ investments and the potential impact on net asset value (“NAV”) per share using various default and recovery rates.
What Are Watch List Investments?
We are continuously monitoring BDC portfolios to identify potential defaults, including loan performance, rating downgrades, specific company/sector news and events, etc. Watchlist investments are portfolio investments that may have upcoming credit issues.
What Is the Default Rate?
The default rate measures the number of loans that have gone into default, usually expressed as a percentage of the total number of loans in a portfolio. A default occurs when a borrower fails to make the required payments on a loan. The default rate is an indicator of the credit quality of a loan portfolio and can be used to assess the risk of a lender’s portfolio. Default rates can be affected by various factors, including the quality of the loan portfolio, the state of the economy, and the effectiveness of the lender’s loan underwriting and risk management practices.
What Is the Recovery Rate?
The recovery rate is a measure of the amount of capital that a lender can recover from a loan that has gone into default, typically expressed as a percentage of the original loan amount. The recovery rate reflects the ability of the lender to collect on a defaulted loan and can be used to assess the risk of a lender’s portfolio. A higher recovery rate generally indicates that the lender has taken steps to minimize its losses from defaulted loans, such as securing collateral, using loan guarantees, or taking legal action against the borrower. A lower recovery rate may indicate that the lender has not taken adequate steps to protect its interests and may result in higher losses from defaulted loans. The recovery rates on first-lien secured debt positions with appropriate covenants/protections/collateral will be much higher than junior/subordinated positions.
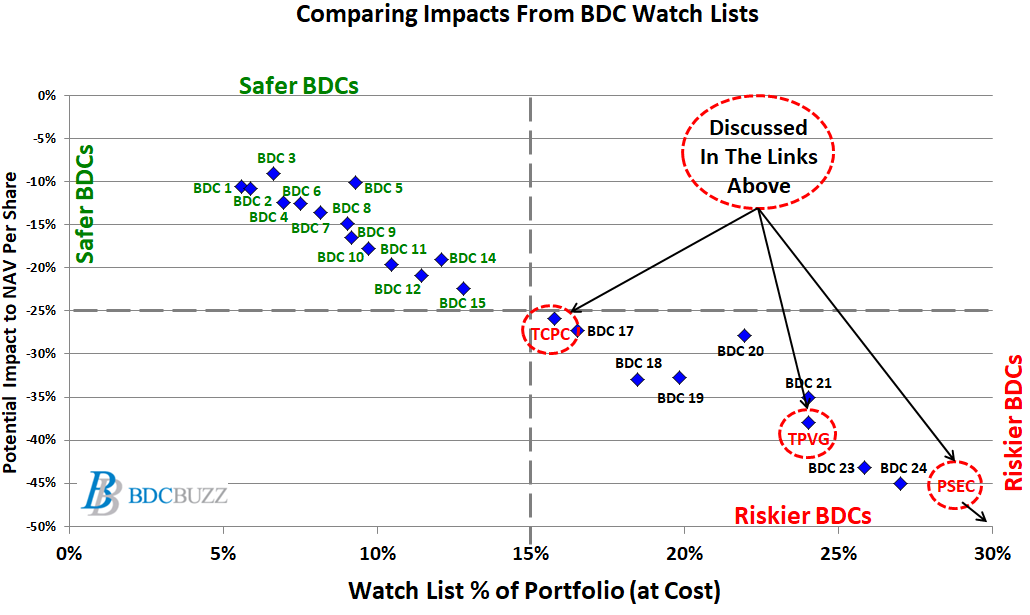
Comparing BDC Watch Lists
The following chart shows the potential impact on NAV per share for each BDC, assuming that 100% of watch list investments (including non-accruals) defaulted with 0% recovery. This is the worst-case scenario for this group of investments.
The largest NAV declines were mostly BDCs with larger amounts of watch list investments. Subscribers who believe the economy is headed for a ‘hard landing’ with a deep, broad, and/or extended recession should focus on the BDCs closer to the top left corner. You can find the most recently updated chart comparing BDC watch lists in the weekly sector updates at the following link:
We currently cover 25 BDCs which are shown below and provided examples for TCPC 0.00%↑, TPVG 0.00%↑, and PSEC 0.00%↑ which are discussed in the following updates:
TCPC: Another NAV Decline